
Image
|
Figure Caption
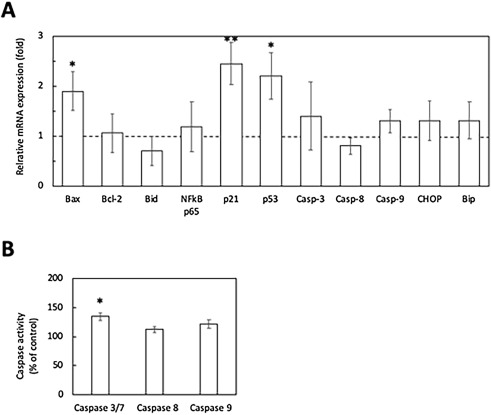
Fig. 6 Effects of EZA treatment on expression of genes for the apoptotic pathway (A) and caspase activities (B). The otic mRNA expression levels of some markers for the apoptotic pathway (A) and caspase activities (B) in inner ears isolated from EZA-treated zebrafish larvae (3 dpf) were determined. The EZA treatment was performed at 80 ppb for 3 days. The mRNA levels were measured by quantitative real-time PCR using the comparative Ct method. β-Actin was used as an internal control for normalization. The bars represent means ± SD (n = 3) (Student’s t-test, *p < 0.05, **p < 0.01).
Acknowledgments
This image is the copyrighted work of the attributed author or publisher, and
ZFIN has permission only to display this image to its users.
Additional permissions should be obtained from the applicable author or publisher of the image.
Full text @ Toxicol Rep