
Image
|
Figure Caption
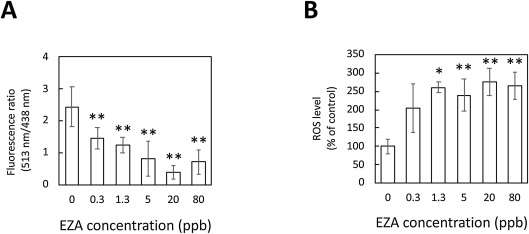
Fig. 2 pH decrease and ROS generation in larvae induced by EZA. (A) pH decrease in larvae on EZA treatment. pH changes in 3-dpf larvae treated with 0–80 ppb EZA for 3 days. (B) The ROS levels in 3-dpf larvae treated with EZA. The levels are expressed as percentages of the control. The data are means ± SD (n = 3). Asterisks indicate significant differences from the control (ANOVA followed by Dunnet’s test: *p < 0.05, **p < 0.01).
Acknowledgments
This image is the copyrighted work of the attributed author or publisher, and
ZFIN has permission only to display this image to its users.
Additional permissions should be obtained from the applicable author or publisher of the image.
Full text @ Toxicol Rep