
Image
|
Figure Caption
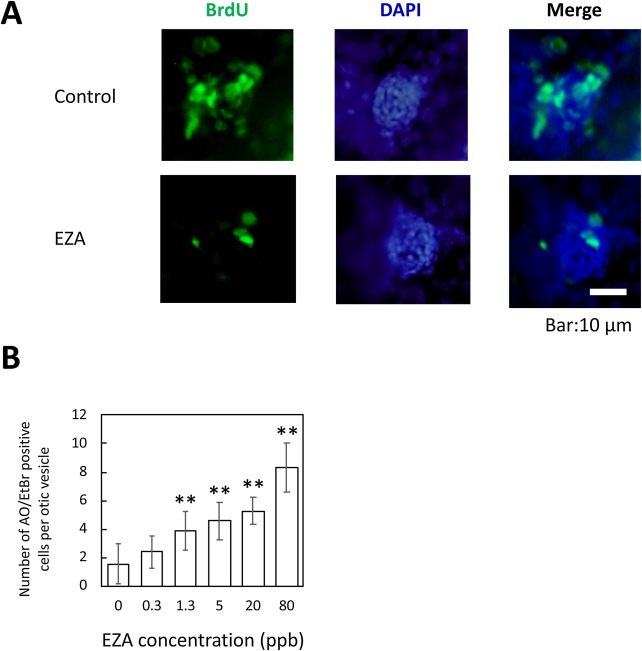
Fig. 5 Effect of EZA on otic neuromast cell proliferation and apoptotic cells in otic vesicle. (A) Repression of progression to the S-phase of the cell cycle by EZA. DNA-replicating cells were labeled with BrdU. (B) Apoptosis of cells in the otic vesicle. Apoptotic cells were detected by Acridine orange/Ethidium bromide, and were counted and plotted as mean ± SD (n = 3). Asterisks indicate significant differences from the control (ANOVA followed by Dunnet’s test: **p < 0.01).
Acknowledgments
This image is the copyrighted work of the attributed author or publisher, and
ZFIN has permission only to display this image to its users.
Additional permissions should be obtained from the applicable author or publisher of the image.
Full text @ Toxicol Rep