
|
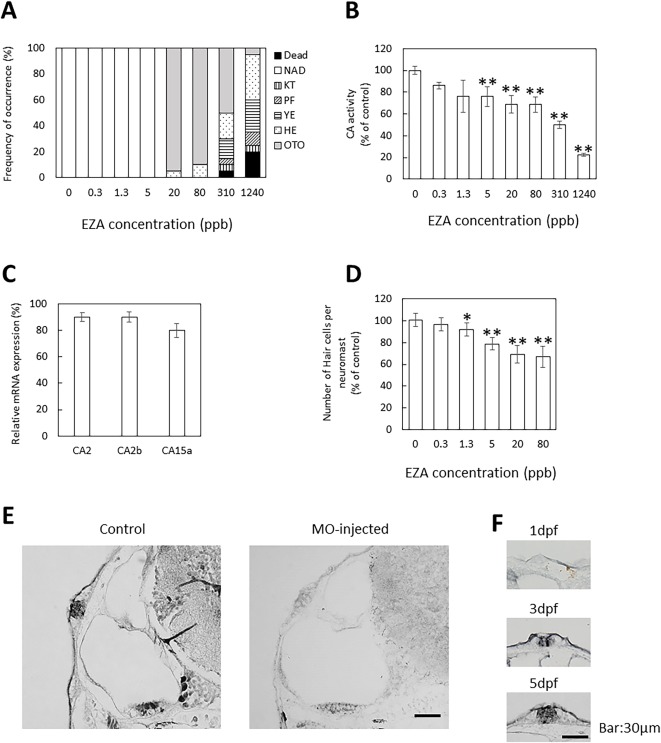
Fig. 1 Effects of EZA exposure on CA activity and otic neuromast development and location of CA in otic neuromasts. (A) Effects of EZA during zebrafish development. Analysis was performed at 3 dpf; 20 embryos were observed for each dose. The values are percentage of abnormal embryos. NAD, no abnormality detected; KT, kinked tail; PF, irregular pectoral fin; YE, Yolk edema; HE, Heart edema; OTO, small otolith. (B) Effects of EZA on CA activity. CA activity in the cytosol fraction of larvae treated with various concentrations of EZA for 3 days was measured at 3 dpf. (C) Effects of EZA on CA mRNA levels. mRNA levels of CA2, 2b and 15a in larvae treated with 80 ppb EZA for 3 days was determined at 3 dpf. The mRNA levels were measured by quantitative real-time PCR using the comparative Ct method. β-Actin was used as an internal control for normalization. (D) Effects of EZA on otic neuromast. Hair cells of otic neuromasts labeled with YO-PRO-1 after exposure to various concentrations of EZA for 3 days were counted. (E, F) Location of CA in otic neuromast. Localization of CA2 in otic neuromasts of normal zebrafish at 5 dpf (E) and 1–5 dpf (F) visualized by immunohistochemical staining. Transverse sections of otocysts in non-treated (E, F) and MO-injected (E) larvae were stained with rabbit anti-CA antiserum. The values are expressed as arbitrary units and as percentages of the control. The data are means ± SD (n = 3). Asterisks indicate significant differences from the control (ANOVA followed by Dunnet’s test: *p < 0.05, **p < 0.01).