
- Title
-
Pthlha and mechanical force control early patterning of growth zones in the zebrafish craniofacial skeleton
- Authors
- Hoyle, D.J., Dranow, D.B., Schilling, T.F.
- Source
- Full text @ Development
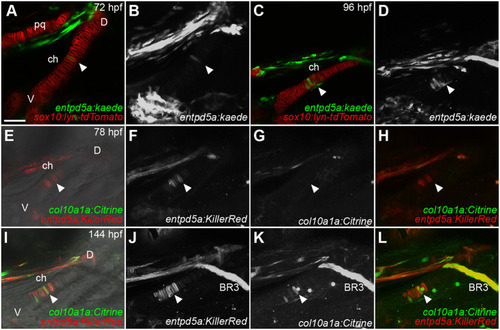
Pre-hypertrophic ceratohyal (ch) chondrocytes express entpd5a:kaede soon after differentiation. Confocal images of live double-transgenic embryos. (A-D) sox10:lyn-tdtomato;entpd5a:kaede double-transgenic embryos at 72 hpf (A,B) and 96 hpf (C,D). (E-L) col10a1a:Citrine;entpd5a:KillerRed double-transgenic embryos at 78 hpf (E-H) and 144 hpf (I-L). (E,I) Optical slices in DIC. (A,C,E,I) Optical slices. (B,D,F-H,J-L) z-projections. White arrowheads indicate the position of the pre-HZ. BR3, branchiostegal ray 3; ch, ceratohyal; D, dorsal; pq, palatoquadrate; V, ventral. All micrographs are ventral views with anterior to the left. Scale bar: 50 μm (A-L). |
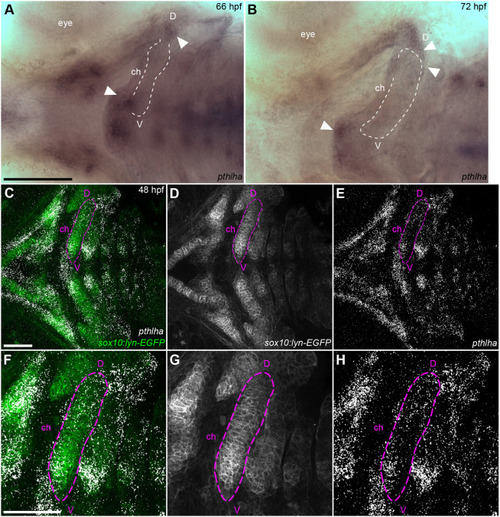
pthlha is expressed in dorsal and ventral subdomains of ch cartilage progenitors prior to differentiation. (A,B) In situ hybridization for pthlha mRNA at 66 hpf (A) and 72 hpf (B). The ch cartilage is outlined. White arrowheads indicate pthlha expression zones. (C-H) pthlha HCR in sox10:lyn-EGFP;entpd5a:KillerRed double-transgenic embryos at 48 hpf. F-H show magnified views of the outlined ch cartilage. entpd5a:KillerRed is not detected at 48 hpf. Ventral views, anterior to the left. ch, ceratohyal; D, dorsal; V, ventral. Scale bars: 100 μm (A,B); 50 μm (C-H). |
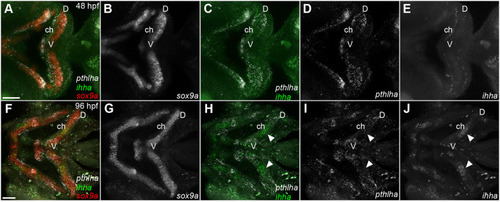
pthlha expression in cartilage progenitors precedes expression of ihha. (A-J) HCR in situ hybridization for pthlha, ihha and sox9a in wild-type embryos at 48 hpf (A-E) and 96 hpf (F-J). White arrowheads indicate the ceratohyal ihha expression domain. All micrographs are ventral view z-projections with anterior to the left. ch, ceratohyal; D, dorsal; V, ventral. Scale bar: 50 μm (A-J). |
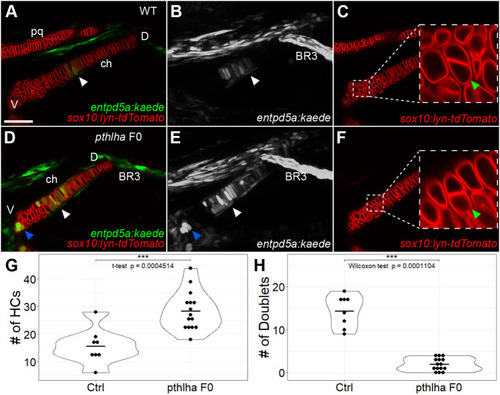
Loss of pthlha leads to dorsal expansion of entpd5a-expressing pre-hypertrophic chondrocytes in ch cartilage. (A-C) Live imaging of wild-type sox10:lyn-tdTomato;entpd5a:kaede double-transgenic embryos; ventral views. (D-F) Live imaging of pthlha CRISPR F0 sox10:lyn-tdTomato;entpd5a:kaede double-transgenic embryos; ventral views. (C,F) Optical slices showing the sox10:lyn-tdTomato chondrocyte doublets, magnified in insets. (A,C,D,F) Optical slices, (B,E) z-projections. White arrowheads indicate the position of the HZ. Blue arrowheads indicate the position of the secondary HZ. Green arrowheads indicate the position of chondrocyte doublets. (G) Quantification of entpd5a:kaede-labeled pre-hypertrophic chondrocytes (HCs) in the ch cartilage. (H) Quantification of chondrocyte doublets in the ch cartilage. BR3, branchiostegal ray 3; ch, ceratohyal; Ctrl, control; D, dorsal; pq, palatoquadrate; V, ventral. Scale bar: 50 μm (A-F). |
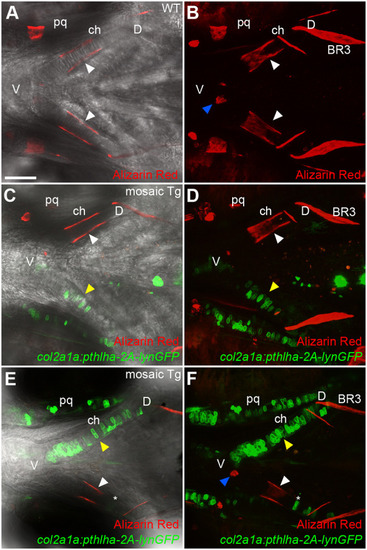
Mosaic pthlha misexpression in ch cartilage disrupts ch ossification patterns. (A-F) Live imaging of 144 hpf wild-type (A,B) and col2a1a:pthlha-2A-lynGFP mosaic transgenic (C-F) embryos treated with Alizarin Red. (A,C,E) Optical slices in DIC. (B,D,F) z-projections. White arrowheads indicate the position of the HZ. Yellow arrowheads indicate the position of col2a1a:pthlha-2A-lynGFP-expressing cells. Blue arrowheads indicate the position of the secondary hypertrophic HZ. Asterisks indicate the position of a col2a1a:pthlha-2A-lynGFP-labeled cell disrupting bone collar formation. BR3, branchiostegal ray 3; ch, ceratohyal; D, dorsal; pq; palatoquadrate; V, ventral. All micrographs are ventral views with anterior to the left. Scale bar: 50 μm (A-F). |
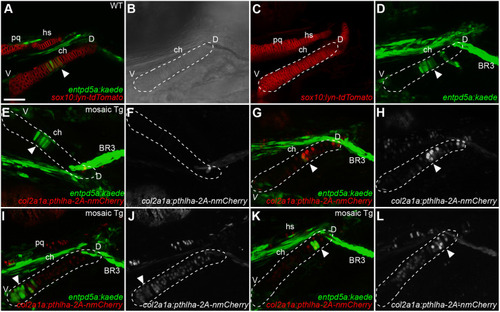
Mosaic pthlha misexpression in ch cartilage disrupts localization of entpd5a-expressing pre-hypertrophic chondrocytes. (A-D) Live imaging of a wild-type sox10:lyn-tdTomato;entpd5a:kaede double-transgenic embryo. (B) DIC channel, used to draw an outline of the ch cartilage (dashed line). (E-L) Live imaging of entpd5a:kaede transgenic embryos injected with the col2a1a:pthlha-2A-nmCherry construct. (E-H) Example of a single embryo with no col2a1a:pthlha-2A-nmCherry expression on one side of the ch cartilage (E,F) where entpd5a:kaede in the HZ is undisrupted, and the transgenic side of the same embryo (G,H) with col2a1a:pthlha-2A-nmCherry expression disrupting entpd5a:kaede expression in the HZ. (I,J) Example of another injected embryo in which col2a1a:pthlha-2A-nmCherry expression moves the HZ to the ventral part of the ceratohyal. (K,L) Another mosaic transgenic embryo in which col2a1a:pthlha-2A-nmCherry expression moves the HZ to the dorsal part of the ceratohyal. White arrowheads indicate the position of the HZ. BR3, branchiostegal ray 3; ch, ceratohyal; D, dorsal; hs, hyosymplectic; pq, palatoquadrate; V, ventral. (A,E,G,I,K) Optical slices. (C,D,F,H,J,L) z-projections. All micrographs are ventral views with anterior to the left. Scale bar: 50 μm (A-L). |
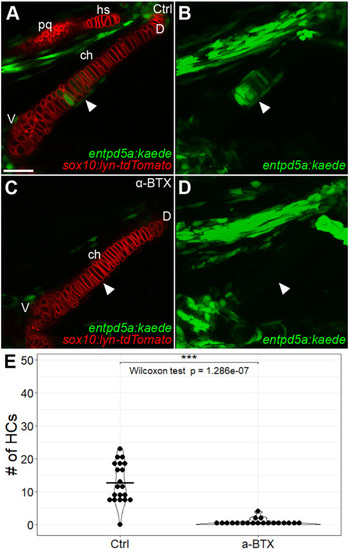
Early paralysis reduces numbers of entpd5a-expressing pre-hypertrophic chondrocytes in ch cartilage. (A-D) Live imaging of wild-type control (A,B) and α-BTX-injected paralyzed (C,D) sox10:lyn-tdTomato;entpd5a:kaede double-transgenic embryos at 96 hpf. The HZ does not develop in α-BTX-injected animals. (A,C) Optical slices. (B,D) z-projections. White arrowheads indicate the position of the HZ. (E) Quantification of number of entpd5a:kaede-labeled chondrocytes in the ch cartilage. ch, ceratohyal; D, dorsal; hs, hyosymplectic; pq, palatoquadrate; V, ventral. All micrographs are ventral views with anterior to the left. Scale bar: 50 μm (A-D). |
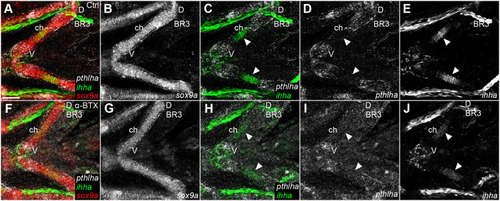
Early paralysis leads to a reduction in ihha expression in pre-hypertrophic chondrocytes and redistribution of pthlha. (A-J) Wild-type control (A-E) and α-BTX-injected paralyzed (F-J) entpd5a:kaede transgenic embryos at 96 hpf. All micrographs are ventral view z-projections with anterior to the left. White arrowheads indicate the ceratohyal ihha expression zones. BR3, branchiostegal ray 3; ch, ceratohyal; D, dorsal; V, ventral. Scale bar: 50 μm (A-J). |
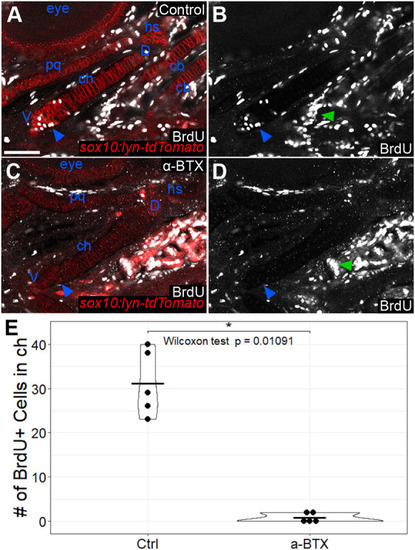
Later paralysis leads to reductions in chondrocyte proliferation. (A-D) Anti-BrdU antibody staining of wild-type (A,B) and α-BTX-injected paralyzed (C,D) sox10:lyn-tdTomato transgenic embryos at 120 hpf. BrdU staining is absent from cartilages, but not from other tissues in α-BTX-injected animals. Blue arrowheads indicate the ventral aspect of the ch cartilage where chondrocyte proliferation appears to concentrate. Green arrowheads indicate proliferation in tissues other than cartilage. All micrographs are ventral view optical slices with anterior to the left. (E) Quantification of BrdU-labeled cells in the ch cartilage. cb, ceratobranchial; D, dorsal; ch, ceratohyal; hs, hyosymplectic pq, palatoquadrate; V, ventral. Scale bar: 50 μm (A-D). |
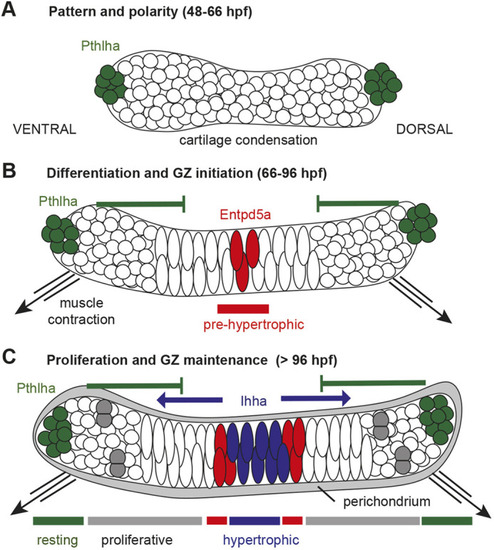
Model for growth zone establishment in the zebrafish ceratohyal cartilage. (A-C) Diagram of GZ development in a single ch cartilage on one side of the head as chondrocytes condense (A), differentiate (B) and begin to proliferate (C); ventral to the left. (A) Pthlha-expressing cells (green) are first detected at either end of the developing cartilage condensation at 48-66 hpf. (B) Entpd5a-expressing cells (red) are first detected near the center of the differentiating chondrocyte stack at 66-72 hpf, correlating with the onset of cranial muscle contraction (black arrows). (C) A mature GZ including Ihha expression (blue) acting in opposition to Pthlha (green); cartilage proliferation (gray doublets) and a distinct perichondrium (gray margin) emerge after 96 hpf. |