
Fig. 4.
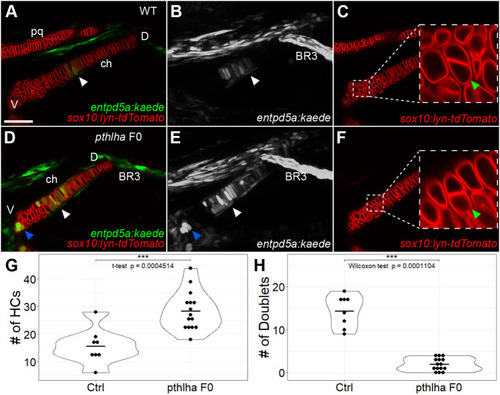
Loss of pthlha leads to dorsal expansion of entpd5a-expressing pre-hypertrophic chondrocytes in ch cartilage. (A-C) Live imaging of wild-type sox10:lyn-tdTomato;entpd5a:kaede double-transgenic embryos; ventral views. (D-F) Live imaging of pthlha CRISPR F0 sox10:lyn-tdTomato;entpd5a:kaede double-transgenic embryos; ventral views. (C,F) Optical slices showing the sox10:lyn-tdTomato chondrocyte doublets, magnified in insets. (A,C,D,F) Optical slices, (B,E) z-projections. White arrowheads indicate the position of the HZ. Blue arrowheads indicate the position of the secondary HZ. Green arrowheads indicate the position of chondrocyte doublets. (G) Quantification of entpd5a:kaede-labeled pre-hypertrophic chondrocytes (HCs) in the ch cartilage. (H) Quantification of chondrocyte doublets in the ch cartilage. BR3, branchiostegal ray 3; ch, ceratohyal; Ctrl, control; D, dorsal; pq, palatoquadrate; V, ventral. Scale bar: 50 μm (A-F). |