
|
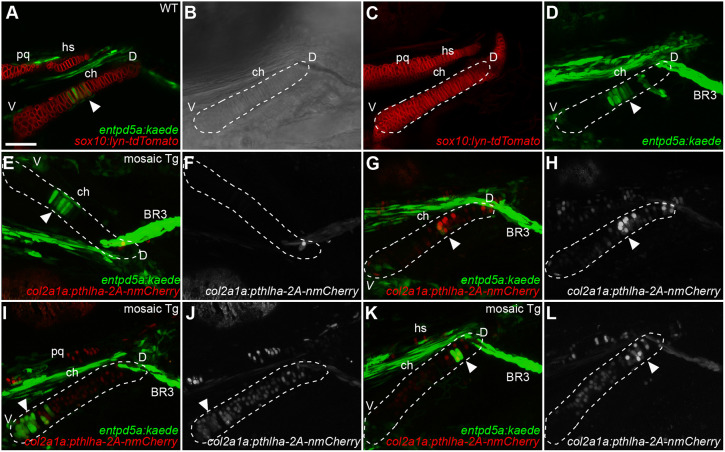
Fig. 6.
Mosaic pthlha misexpression in ch cartilage disrupts localization of entpd5a-expressing pre-hypertrophic chondrocytes. (A-D) Live imaging of a wild-type sox10:lyn-tdTomato;entpd5a:kaede double-transgenic embryo. (B) DIC channel, used to draw an outline of the ch cartilage (dashed line). (E-L) Live imaging of entpd5a:kaede transgenic embryos injected with the col2a1a:pthlha-2A-nmCherry construct. (E-H) Example of a single embryo with no col2a1a:pthlha-2A-nmCherry expression on one side of the ch cartilage (E,F) where entpd5a:kaede in the HZ is undisrupted, and the transgenic side of the same embryo (G,H) with col2a1a:pthlha-2A-nmCherry expression disrupting entpd5a:kaede expression in the HZ. (I,J) Example of another injected embryo in which col2a1a:pthlha-2A-nmCherry expression moves the HZ to the ventral part of the ceratohyal. (K,L) Another mosaic transgenic embryo in which col2a1a:pthlha-2A-nmCherry expression moves the HZ to the dorsal part of the ceratohyal. White arrowheads indicate the position of the HZ. BR3, branchiostegal ray 3; ch, ceratohyal; D, dorsal; hs, hyosymplectic; pq, palatoquadrate; V, ventral. (A,E,G,I,K) Optical slices. (C,D,F,H,J,L) z-projections. All micrographs are ventral views with anterior to the left. Scale bar: 50 μm (A-L).