
- Title
-
Abnormal brain development of monoamine oxidase mutant zebrafish and impaired social interaction of heterozygous fish
- Authors
- Baronio, D., Chen, Y.C., Panula, P.
- Source
- Full text @ Dis. Model. Mech.
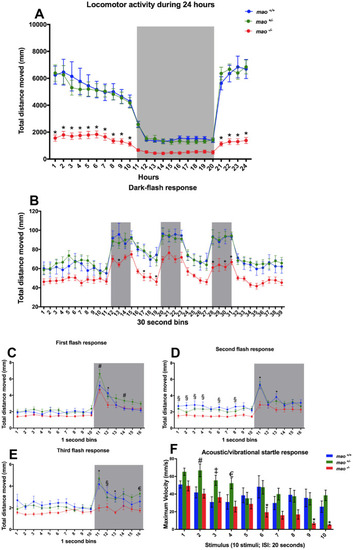
Behavioral phenotype of mao mutants. (A) mao−/− larvae were hypoactive during diurnal and nocturnal (gray shaded area) locomotor activity tracking at 6 dpf. n=16 for mao+/+, n=16 for mao+/− and n=15 for mao−/−. (B) Larvae at 6 dpf were exposed to alternating 2 min periods of light and darkness (gray shaded areas), with three periods of darkness in total. n=15 mao+/+ and n=16 for mao+/− and mao−/−. (C-E) Analysis of the larval response to sudden darkness [first (C), second (D) and third (E) flash response] in 1 s bins. Gray shaded areas indicate periods of darkness. (F) Mean values for maximum velocity during ten acoustic/vibrational stimuli with a 20 s interstimulus interval (ISI). n=15 for mao+/+, n=16 for mao+/− and n=12 for mao−/−. Two-way ANOVA followed by Tukey's post hoc test was used for statistical analysis. #P<0.05 (mao+/− versus mao+/+ and mao−/−), *P<0.05 (mao+/+ and mao+/− versus mao−/−), §P<0.05 (mao+/+ versus mao−/−), €P<0.05 (mao+/− versus mao−/−), ‡P<0.05 (mao+/− versus mao+/+). PHENOTYPE:
|
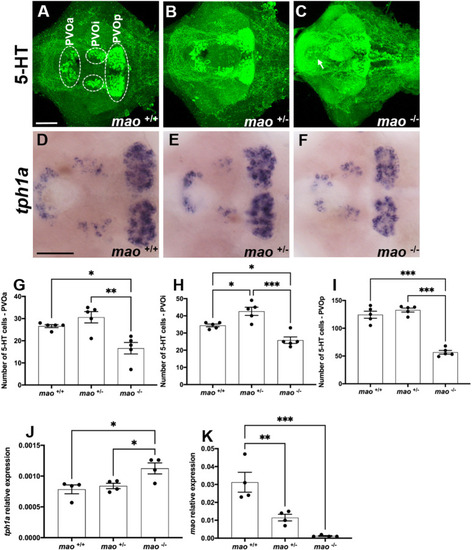
The serotonergic system of mao mutants. (A-C) Ventral views of whole-mount 10 dpf mao+/+ (A), mao+/− (B) and mao−/− (C) larval brains, anterior to the left, processed for serotonin (5-HT) immunostaining. Arrow indicates ectopic cells in mao−/− brain. n=5 for each genotype. (D-F) Ventral views of whole-mount 10 dpf mao+/+ (D), mao+/− (E) and mao−/− (F) larval brains, anterior to the left, processed for tph1a RNA in situ hybridization (ISH). (G-I) Bar charts showing results of 5-HT-immunoreactive cell counting in larval brains [paraventricular organ anterior part (PVOa; G), paraventricular organ intermediate part (PVOi; H) and paraventricular organ posterior part (PVOp; I)] of the indicated genotype at 10 dpf. (J,K) Bar charts showing results of reverse transcriptase-quantitative PCR (RT-qPCR) analysis of tph1a (J) and mao (K) in larvae of the indicated genotype at 10 dpf. Data are mean±s.e.m. One-way ANOVA followed by Tukey's post hoc test was used for statistical analysis. *P<0.05, **P<0.01, ***P<0.001. Scale bars: 75 μm. |
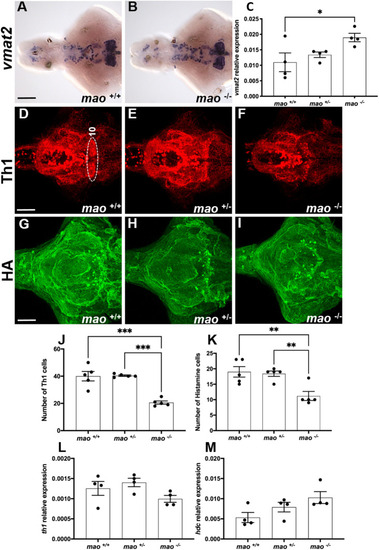
The dopaminergic and histaminergic systems of mao mutants. (A,B) Ventral views of whole-mount 10 dpf mao+/+ (A) and mao−/− (B) larval brains, anterior to the left, processed for vmat2 RNA ISH. n=4 for each genotype. (C) Bar charts showing results from RT-qPCR analysis of vmat2 in larvae of the indicated genotype at 10 dpf. n=4 for each genotype. (D-F) Ventral views of whole-mount 10 dpf mao+/+ (D), mao+/− (E) and mao−/− (F) larval brains, anterior to the left, processed for tyrosine hydroxylase 1 (Th1) immunostaining. n=5 for each genotype. (G-I) Ventral views of whole-mount 10 dpf mao+/+ (G), mao+/− (H) and mao−/− (I) larval brains, anterior to the left, processed for histamine (HA) immunostaining. n=5 for each genotype. (J,K) Bar charts showing results from Th1- and histamine-immunoreactive cell counting in larval brains of the indicated genotype at 10 dpf. (L,M) Bar charts showing results from RT-qPCR analysis of th1 (L) and hdc (M) in larvae of the indicated genotype at 10 dpf. Data are mean±s.e.m. One-way ANOVA followed by Tukey's post hoc test was used for statistical analysis. *P<0.05, **P<0.01, ***P<0.001. Scale bars: 75 μm. |

mao−/− larvae exhibit altered expression of developmental markers. (A,B) Ventral views of whole-mount 10 dpf mao+/+ (A) and mao−/− (B) larval brains, anterior to the left, processed for notch1a RNA ISH. n=4 for each genotype. (C-F) Bar charts showing results from RT-qPCR analysis of notch1a (C), neurod1 (D), apoeb (E) and gfap (F) in larvae of the indicated genotype at 10 dpf. n=4 for each genotype. Data are mean±s.e.m. One-way ANOVA followed by Tukey's multiple comparisons test for statistical analysis. *P<0.05, **P<0.01. Scale bar: 75 μm. |
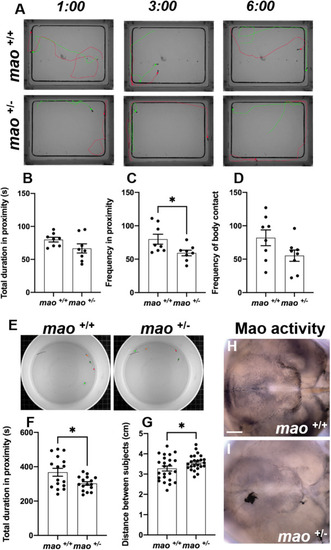
Social cohesion of mao+/− juvenile fish is impaired. (A) Representative images of three different time points during the social contact behavior of mao+/+ and mao+/− fish at 30 dpf. n=8 for each genotype. (B,C) Bar charts showing total duration (B) and frequency (C) in proximity to other fish for the indicated genotypes. (D) Bar charts showing frequency of body contact for the indicated genotypes. (E) Representative images of 40 dpf mao+/+ and mao+/− fish during the shoaling behavior evaluation. n=4 for each genotype. (F) Bar charts showing total duration in proximity to other fish during shoaling behavior for the indicated genotypes. (G) Bar charts showing average distance between fish of the indicated genotype during shoaling behavior. (H,I) Ventral views of whole-mount 40 dpf mao+/+ (H) and mao−/− (I) brains, anterior to the left, processed for Mao activity. mao+/− fish show weaker Mao activity after shoaling behavior. n=4 for each genotype. Data are mean±s.e.m. Unpaired, two-tailed Student's t-test was used for statistical analysis. *P<0.05. Scale bar: 75 μm. PHENOTYPE:
|
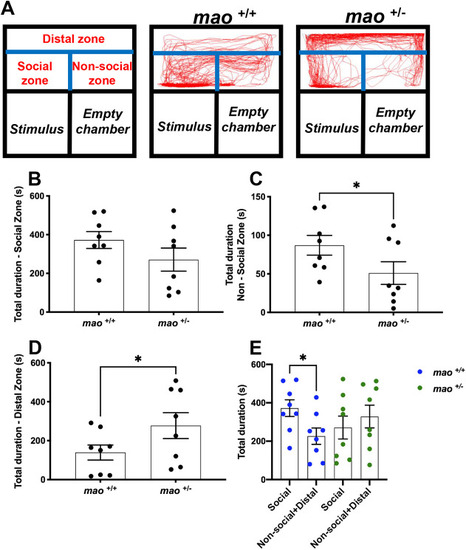
Social preference of mao+/− adult fish is impaired. (A) Representation of the apparatus used to study the social behavior of adult mao+/+ and mao+/− fish and traces of the swimming pattern from both genotypes. Fish behavior was evaluated during a 10 min video recording session in a home-made social interaction apparatus. The apparatus is physically divided into three chambers and digital zones (distal, social and non-social), which were established with EthoVision XT 13 software. n=8 for each genotype. (B-E) Bar charts showing results on the time spent in each zone [social (B), non-social (C), distal (D) and total (E)]. Compared to their siblings, mao+/− adult fish did not differ in the time spent closer to the social stimulus, spent less time in the non-social zone and more time in the distal zone. When the time spent in the distal zone and non-social zones was summed, the mao+/+ fish show a preference for the area closer to the social stimulus, whereas when the same comparison is done with their mao+/− siblings, no preference is detected. Data are mean±s.e.m. Unpaired, two-tailed Student's t-test was used for statistical analysis. *P<0.05. PHENOTYPE:
|
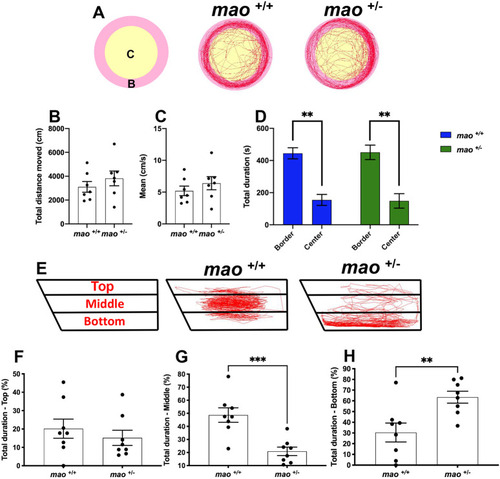
Locomotor activity and novel tank test of adult mao+/+ and mao+/− fish. (A) Representation of the arena with digital zones and representative swimming traces of mao+/+ and mao+/− fish during a 10 min recording period. n=7 for each genotype. (B,C) Bar charts showing individual values for total distance moved (B) and average velocity (C) of fish of the indicated genotype. (D) Bar charts showing thigmotaxis larval behavior. (E) Schemes of the novel tank test with three digital zones and representative swimming traces of mao+/+ and mao+/− fish during a 6 min recording period. n=8 for each genotype. (F-H) Bar charts showing results on the time spent in each zone [top (F), middle (G) and bottom (H)]. Compared to their siblings, mao+/− adult fish did not differ in the time spent in the upper part of the tank, spent less time in the middle and more time in the bottom part. Data are mean±s.e.m. Unpaired, two-tailed Student's t-test was used for statistical analysis. **P<0.01, ***P<0.001. PHENOTYPE:
|
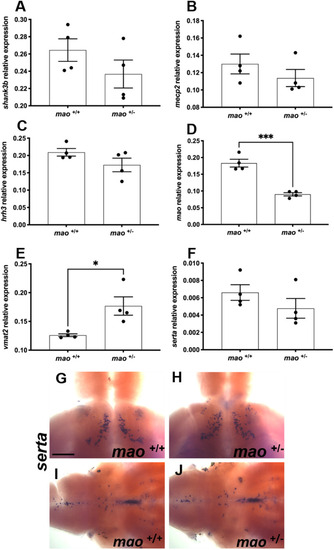
Gene expression in adult mao+/+ and mao+/− fish. (A-F) Bar charts showing results from RT-qPCR analysis of shank3b (A), mecp2 (B), hrh3 (C), mao (D), vmat2 (E) and serta (F) in adult brains of the indicated genotype. A significant decrease in the expression of mao was detected in mao+/− fish compared to mao+/+ siblings. A significant upregulation in the expression of vmat2 was detected in mao+/− fish compared to mao+/+ siblings. (G,H) Dorsal views of whole-mount adult mao+/+ (G) and mao+/− (H) brains, anterior to the top, processed for serta RNA ISH. serta-positive neurons expressed in the ventral posterior tuberculum. (I,J) Ventral views of whole-mount adult mao+/+ (I) and mao+/− (J) brains, anterior to the right, processed for serta RNA ISH. serta-positive neurons expressed in the raphe nuclei and hindbrain. Data are mean±s.e.m. Unpaired, two-tailed Student's t-test was used for statistical analysis. *P<0.05, ***P<0.001. Scale bar: 75 μm |

Unillustrated author statements PHENOTYPE:
|