
Fig. 8.
|
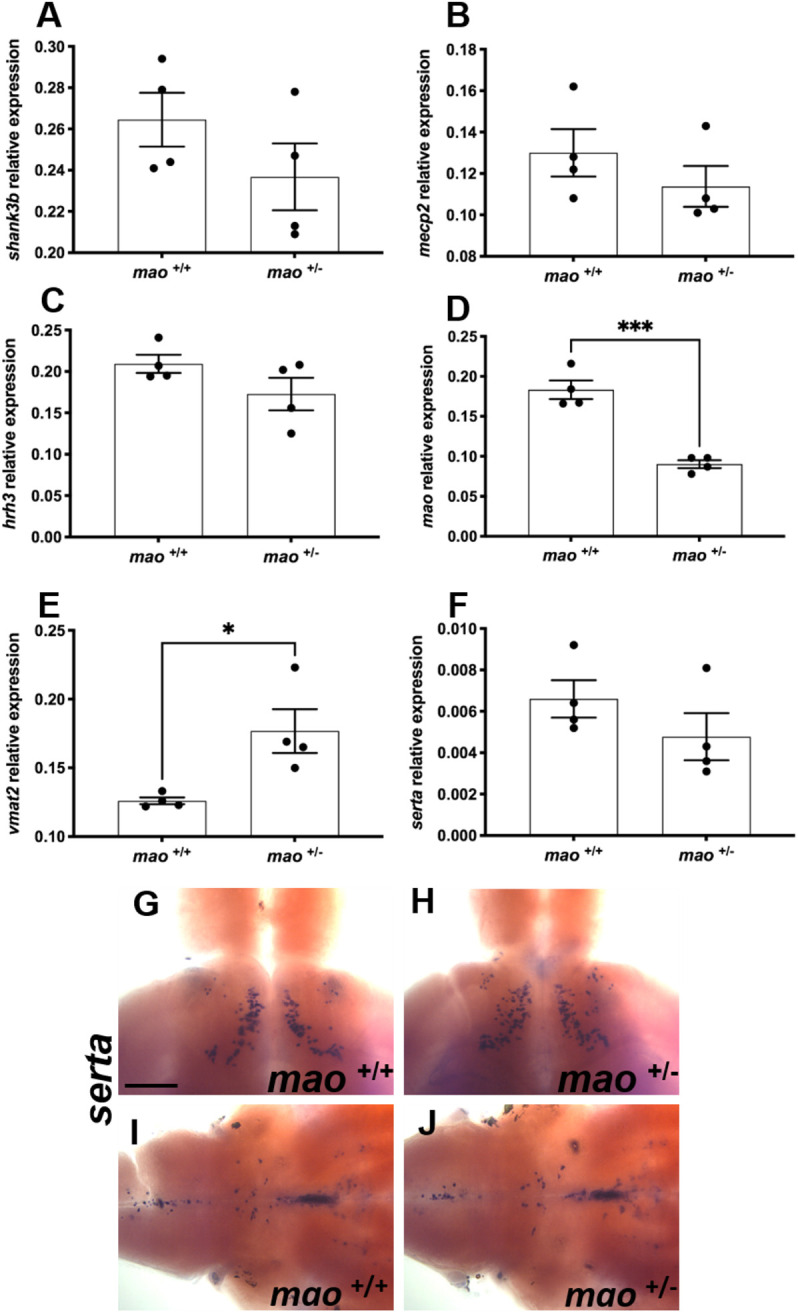
Fig. 8. Gene expression in adult mao+/+ and mao+/− fish. (A-F) Bar charts showing results from RT-qPCR analysis of shank3b (A), mecp2 (B), hrh3 (C), mao (D), vmat2 (E) and serta (F) in adult brains of the indicated genotype. A significant decrease in the expression of mao was detected in mao+/− fish compared to mao+/+ siblings. A significant upregulation in the expression of vmat2 was detected in mao+/− fish compared to mao+/+ siblings. (G,H) Dorsal views of whole-mount adult mao+/+ (G) and mao+/− (H) brains, anterior to the top, processed for serta RNA ISH. serta-positive neurons expressed in the ventral posterior tuberculum. (I,J) Ventral views of whole-mount adult mao+/+ (I) and mao+/− (J) brains, anterior to the right, processed for serta RNA ISH. serta-positive neurons expressed in the raphe nuclei and hindbrain. Data are mean±s.e.m. Unpaired, two-tailed Student's t-test was used for statistical analysis. *P<0.05, ***P<0.001. Scale bar: 75 μm