
- Title
-
Using comprehensive lipid profiling to study effects of PFHxS during different stages of early zebrafish development
- Authors
- Xu, M., Legradi, J., Leonards, P.
- Source
- Full text @ Sci. Total Environ.
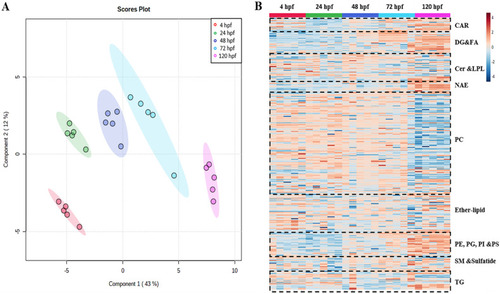
Fig. 1. (A) PLS-DA scores plot of lipid profiles at different zebrafish developmental stages based on normalized peak areas of individual lipids. Shown are the data of 4, 24, 48, 72, and 120 hpf. Ellipses representative the 95% confidence regions. (B) Heatmap of identified lipids based on the normalized MS intensity, from 4 to 120 hpf. |
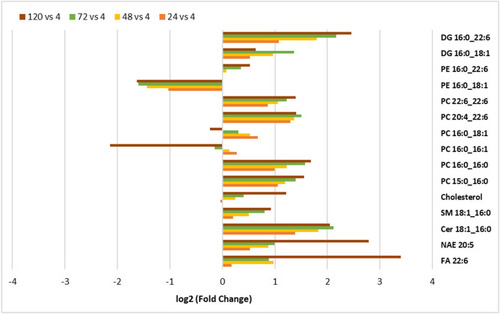
Fig. 2. Log2 fold-change of a selected set of lipids relative to 4 hpf. Shown are the data of 24, 48, 72, and 120 hpf relative to 4 hpf during the development of zebrafish embryos; n = 5 pools of zebrafish embryos. The selected lipids are significantly different (p < 0.05, one-way ANOVA, Fisher's post hoc and FDR) between the developmental stages. |
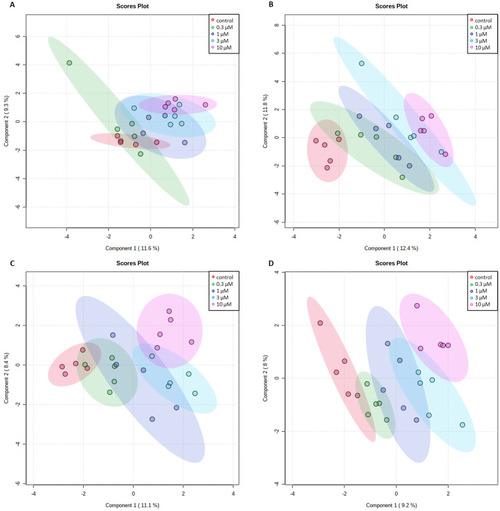
Fig. 3. PLS-DA scores plots of normalized peak areas of individual lipids in zebrafish embryos exposed to PFHxS at different concentrations. Shown are the solvent control, 0.3 μM, 1 μM, 3 μM, and 10 μM PFHxS. A: 24 hpf; B: 48 hpf; C: 72 hpf; and D: 120 hpf. |
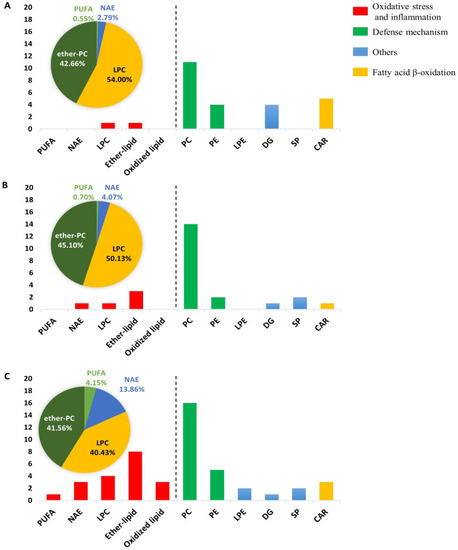
Fig. 4. The number of affected lipids by PFHxS related to different outcomes at the developmental stages: A 48 hpf, B 72 hpf, and C 120 hpf. Lipids are grouped (color coded) as markers for oxidative stress and inflammation (red), defense mechanism (green), fatty acid β-oxidation (yellow), and others (blue). The pie charts showed the percentages of each class of lipids related to oxidative stress and inflammation. (For interpretation of the references to color in this figure legend, the reader is referred to the web version of this article.) |
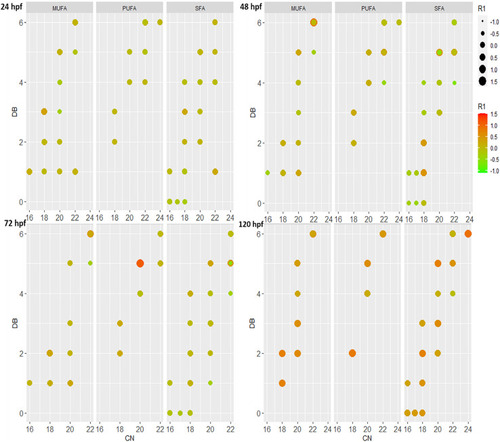
Fig. 5. Log2 fold changes (0.3 μM PFHxS vs. the control) of a selected set of PCs at different exposure duration (24, 48, 72, and 120 hpf). Shown is the number of double bond (Y axis) and carbon number (X axis) of the fatty acyls in position 2 (sn2). The size and color of the circles are related to the log2 fold change (0.3 μM PFHxS vs. the control), see legend. The fatty acyls in position 1 (sn1) were divided into three groups (MUFA: monounsaturated fatty acyl; PUFA: polyunsaturated fatty acyl; SFA: saturated fatty acyl). |
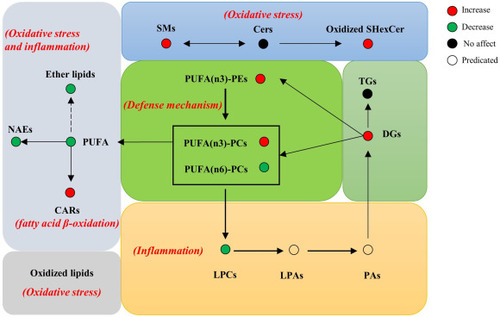
Fig. 6. Suggested scheme of dysregulated lipid metabolism by PFHxS. Indicated are the different adverse outcomes related to the regulated lipids. |