
Image
|
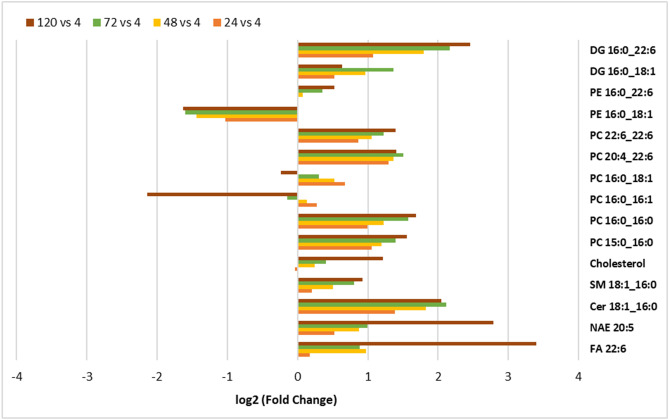
Figure Caption
Fig. 2 Fig. 2. Log2 fold-change of a selected set of lipids relative to 4 hpf. Shown are the data of 24, 48, 72, and 120 hpf relative to 4 hpf during the development of zebrafish embryos; n = 5 pools of zebrafish embryos. The selected lipids are significantly different (p < 0.05, one-way ANOVA, Fisher's post hoc and FDR) between the developmental stages.
Acknowledgments
This image is the copyrighted work of the attributed author or publisher, and
ZFIN has permission only to display this image to its users.
Additional permissions should be obtained from the applicable author or publisher of the image.
Full text @ Sci. Total Environ.