
Image
|
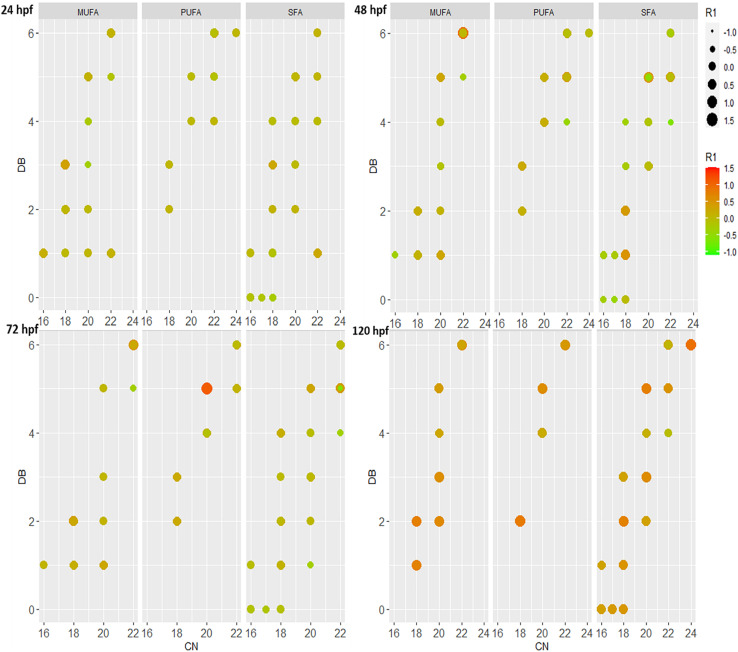
Figure Caption
Fig. 5 Fig. 5. Log2 fold changes (0.3 μM PFHxS vs. the control) of a selected set of PCs at different exposure duration (24, 48, 72, and 120 hpf). Shown is the number of double bond (Y axis) and carbon number (X axis) of the fatty acyls in position 2 (sn2). The size and color of the circles are related to the log2 fold change (0.3 μM PFHxS vs. the control), see legend. The fatty acyls in position 1 (sn1) were divided into three groups (MUFA: monounsaturated fatty acyl; PUFA: polyunsaturated fatty acyl; SFA: saturated fatty acyl).
Acknowledgments
This image is the copyrighted work of the attributed author or publisher, and
ZFIN has permission only to display this image to its users.
Additional permissions should be obtained from the applicable author or publisher of the image.
Full text @ Sci. Total Environ.