
Image
|
Figure Caption
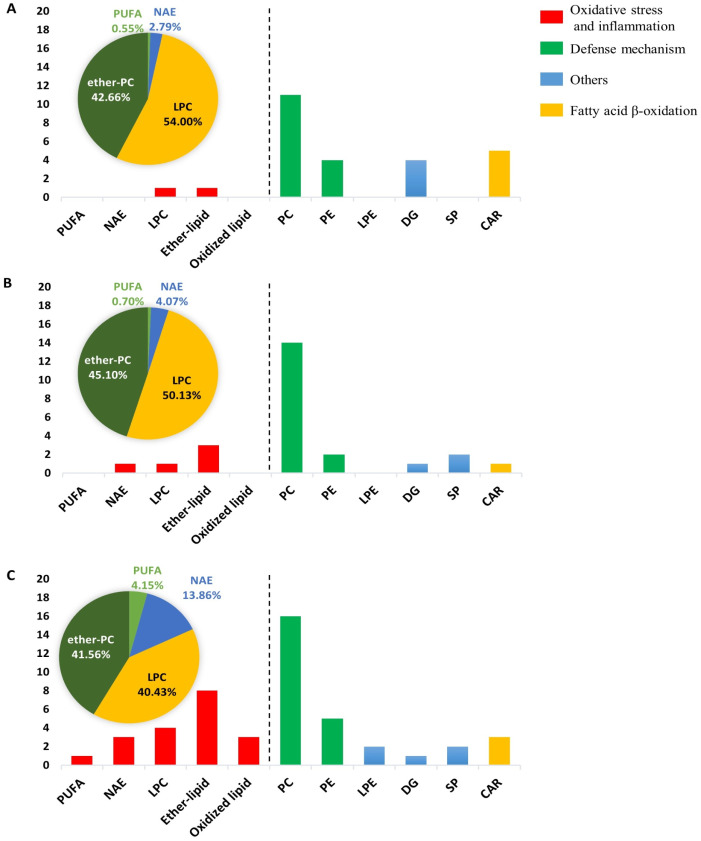
Fig. 4 Fig. 4. The number of affected lipids by PFHxS related to different outcomes at the developmental stages: A 48 hpf, B 72 hpf, and C 120 hpf. Lipids are grouped (color coded) as markers for oxidative stress and inflammation (red), defense mechanism (green), fatty acid β-oxidation (yellow), and others (blue). The pie charts showed the percentages of each class of lipids related to oxidative stress and inflammation. (For interpretation of the references to color in this figure legend, the reader is referred to the web version of this article.)
Acknowledgments
This image is the copyrighted work of the attributed author or publisher, and
ZFIN has permission only to display this image to its users.
Additional permissions should be obtained from the applicable author or publisher of the image.
Full text @ Sci. Total Environ.