
FIGURE
Fig. 4
- ID
- ZDB-FIG-230204-4
- Publication
- Xu et al., 2021 - Using comprehensive lipid profiling to study effects of PFHxS during different stages of early zebrafish development
- Other Figures
- All Figure Page
- Back to All Figure Page
Fig. 4
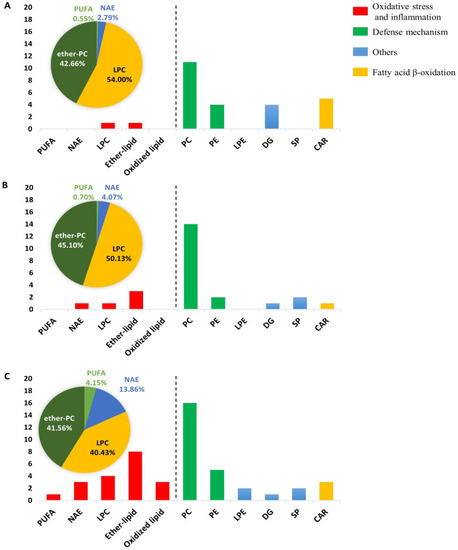
Fig. 4. The number of affected lipids by PFHxS related to different outcomes at the developmental stages: A 48 hpf, B 72 hpf, and C 120 hpf. Lipids are grouped (color coded) as markers for oxidative stress and inflammation (red), defense mechanism (green), fatty acid β-oxidation (yellow), and others (blue). The pie charts showed the percentages of each class of lipids related to oxidative stress and inflammation. (For interpretation of the references to color in this figure legend, the reader is referred to the web version of this article.) |
Expression Data
Expression Detail
Antibody Labeling
Phenotype Data
Phenotype Detail
Acknowledgments
This image is the copyrighted work of the attributed author or publisher, and
ZFIN has permission only to display this image to its users.
Additional permissions should be obtained from the applicable author or publisher of the image.
Full text @ Sci. Total Environ.