
Image
|
Figure Caption
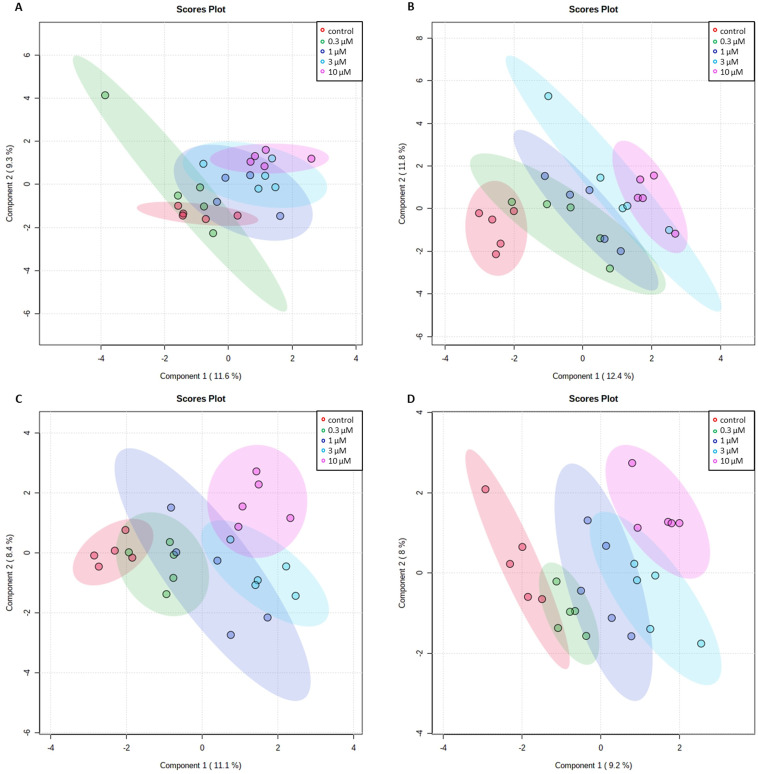
Fig. 3 Fig. 3. PLS-DA scores plots of normalized peak areas of individual lipids in zebrafish embryos exposed to PFHxS at different concentrations. Shown are the solvent control, 0.3 μM, 1 μM, 3 μM, and 10 μM PFHxS. A: 24 hpf; B: 48 hpf; C: 72 hpf; and D: 120 hpf.
Acknowledgments
This image is the copyrighted work of the attributed author or publisher, and
ZFIN has permission only to display this image to its users.
Additional permissions should be obtained from the applicable author or publisher of the image.
Full text @ Sci. Total Environ.