
- Title
-
Zebrafish Model to Study Angiotensin II-Mediated Pathophysiology
- Authors
- Joshi, B., Wagh, G., Kaur, H., Patra, C.
- Source
- Full text @ Biology (Basel)
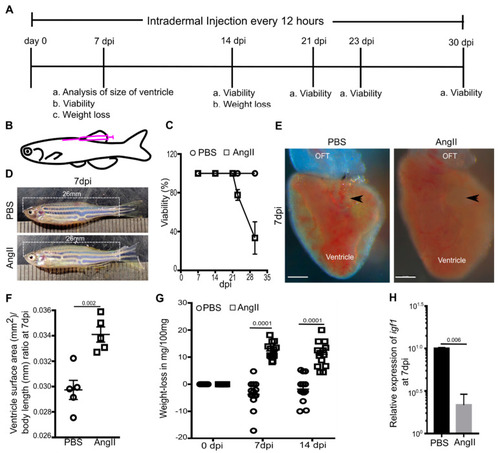
Intradermal Angiotensin II injection induces cardiac hypertrophy in adult zebrafish. (A,B) Diagrams showing experimental procedure (A) and site of intradermal injection (B). (C) Survival assay assessed the viability of the PBS or AngII injected animals at different time points (n = 18 each from 3 independent experiments). Error bars indicate the mean ± s.d. (D) Images of PBS or AngII injected zebrafish at 7 dpi. (E) Bright-field images of cardiac ventricles isolated from PBS or AngII injected animals at 7 dpi. Arrowheads indicate the atrioventricular canal. Scale bars, 200 µm. (F) Statistical analysis of the ratio of the 2D surface area of the ventricle and body length of individual fish at 7 dpi (n = 5 each from 2 independent experiments). (G) Quantitative analysis of weight loss in 14 PBS injected and 14 AngII injected zebrafish from 3 independent experiments. (H) Quantitative analysis of the expression of igf1 in cardiac ventricles from PBS or AngII injected animals at 7 dpi (n = 3, each sample represents a pool of 6 hearts). Error bars indicate the mean ± s.e.m. dpi: days post-injection; OFT, outflow tract. Significant, p < 0.05; non-significant, p ≥ 0.05. |
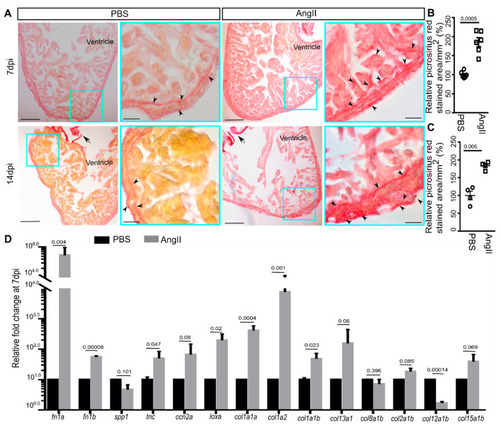
Angiotensin II injection leads to cardiac fibrosis. (A) Bright-field images of picrosirius red-stained sagittal wax sections of cardiac ventricles from PBS or AngII injected animals at 7 dpi and 14 dpi (collagen, red). Arrowheads indicate collagenous scarring in the ventricular tissue and arrows indicate cardiac valves. Scale, low zoom: 100 µm, high zoom: 20 µm. (B,C) Quantitative analysis of the picrosirius red-stained area in the heart sections of PBS or AngII injected animals at 7 dpi (6 each from 2 independent experiments) (B) and 14 dpi (4 each from 2 independent experiments) (C). From each heart, 8–10 sections were analyzed for quantification. The mean of control was considered to be 100%. (D) Quantitative analysis of collagen and fibrosis marker gene expression in cardiac ventricles from PBS or AngII injected animals at 7 dpi (n = 3, each sample represents a pool of 6 hearts). Error bars indicate the mean ± s.e.m. values in (D) are normalized to the mean of the PBS control. Dpi: days post-injection. Significant, p < 0.05; non-significant, p ≥ 0.05. |
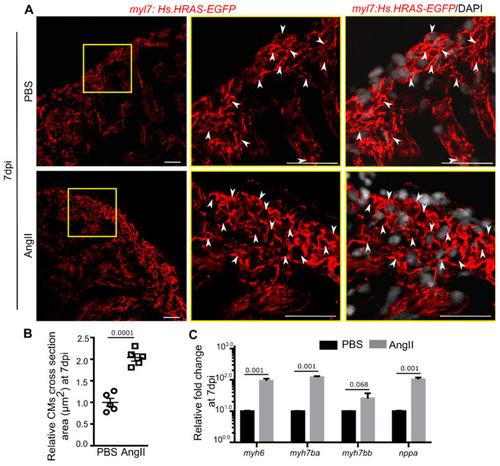
Angiotensin II induces cardiomyocyte hypertrophy in adult zebrafish. (A) Confocal optical sections of transverse cryosections of hearts isolated from PBS or AngII injected animals expressing EGFP in CM plasma membrane (red) and stained with DAPI (white; marks all nuclei). White arrowheads point to the plasma membrane of cross-sectioned CMs. (B) The dot plot represents the relative cross-sectional area of CMs at 7 dpi (n = 5 each from two independent experiments). At least 50 CMs from each section and 2 sections from each heart were included in the analysis. The mean of the cross-sectional area of CMs from PBS injected hearts was set to 1. (C) Quantitative analysis of the expression of hypertrophy marker genes in cardiac ventricles from PBS or AngII injected animals at 7 dpi (n = 3, each sample represents a pool of 6 hearts). Error bars indicate the mean ± s.e.m. values in C were normalized to the mean of PBS control. Dpi: days post-injection. Significant, p < 0.05; non-significant, p ≥ 0.05. Scale: 20 µm. |
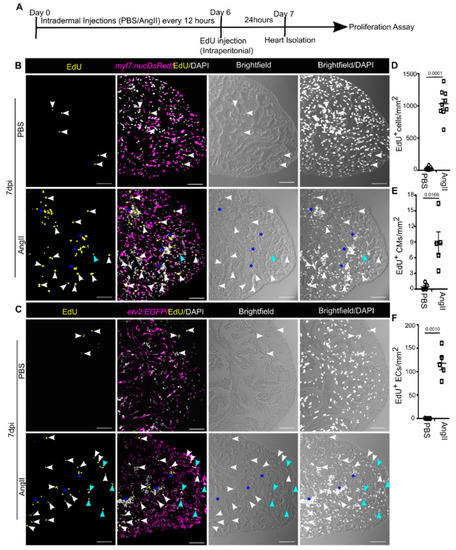
Angiotensin II injection enhances cardiac cell proliferation. (A) Diagram showing the experimental procedure. (B) Representative single plane confocal images of sagittal cryosections of hearts isolated from PBS or AngII injected animals expressing DsRed in CM nuclei (magenta), stained for EdU (yellow: marks proliferating cells), and stained with DAPI (white: marks all nuclei). White and blue arrowheads point to EdU+/DAPI+ cells and EdU+/DAPI+/DsRed+ cells, respectively. Stars indicate cell clusters. (C) Confocal optical sections of sagittal cryosections of hearts isolated from PBS or AngII injected animals expressing EGFP in ECs (magenta), stained for EdU (yellow: marks proliferating cells), and stained with DAPI (white: marks all nuclei). White and blue arrowheads point to EdU+/DAPI+ cells and EdU+/DAPI+/EGFP+ cells, respectively. Stars indicate cell clusters. (D,E) Cardiac cell (n = 9 each) (D) and CM (n = 5 each) (E) proliferation was quantified in cardiac ventricles from PBS or AngII injected animals at 7 dpi. (F) EC proliferation was quantified in cardiac ventricles from PBS or AngII injected animals at 7 dpi (n = 5 each). At least 2 sagittal sections of each heart were analyzed for quantification in (D–F). Error bars indicate the mean ± s.e.m. Dpi: days post-injection. Significant, p < 0.05; non-significant, p ≥ 0.05. Scale: 50 µm. |