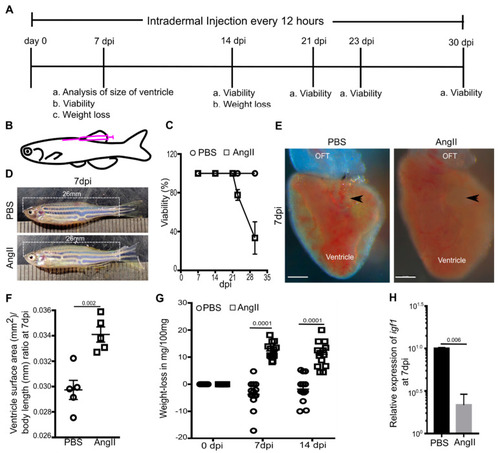
Intradermal Angiotensin II injection induces cardiac hypertrophy in adult zebrafish. (A,B) Diagrams showing experimental procedure (A) and site of intradermal injection (B). (C) Survival assay assessed the viability of the PBS or AngII injected animals at different time points (n = 18 each from 3 independent experiments). Error bars indicate the mean ± s.d. (D) Images of PBS or AngII injected zebrafish at 7 dpi. (E) Bright-field images of cardiac ventricles isolated from PBS or AngII injected animals at 7 dpi. Arrowheads indicate the atrioventricular canal. Scale bars, 200 µm. (F) Statistical analysis of the ratio of the 2D surface area of the ventricle and body length of individual fish at 7 dpi (n = 5 each from 2 independent experiments). (G) Quantitative analysis of weight loss in 14 PBS injected and 14 AngII injected zebrafish from 3 independent experiments. (H) Quantitative analysis of the expression of igf1 in cardiac ventricles from PBS or AngII injected animals at 7 dpi (n = 3, each sample represents a pool of 6 hearts). Error bars indicate the mean ± s.e.m. dpi: days post-injection; OFT, outflow tract. Significant, p < 0.05; non-significant, p ≥ 0.05.
|
