
Figure 2
|
Figure 2
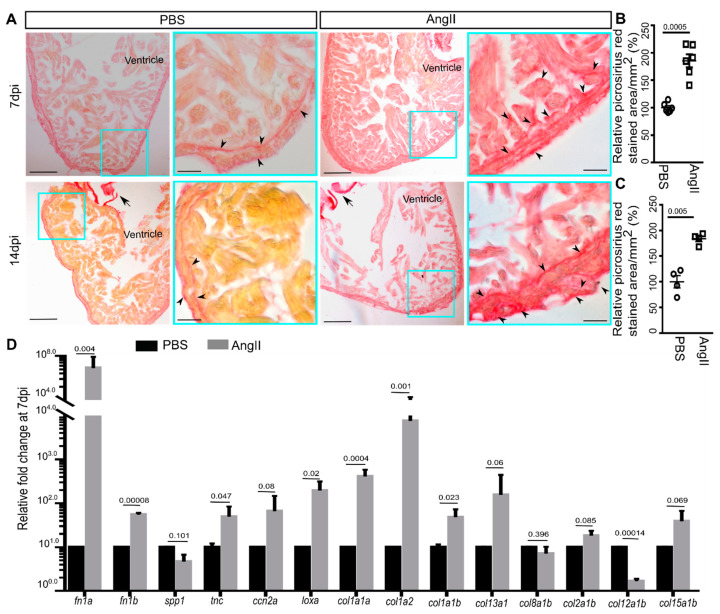
Angiotensin II injection leads to cardiac fibrosis. (A) Bright-field images of picrosirius red-stained sagittal wax sections of cardiac ventricles from PBS or AngII injected animals at 7 dpi and 14 dpi (collagen, red). Arrowheads indicate collagenous scarring in the ventricular tissue and arrows indicate cardiac valves. Scale, low zoom: 100 µm, high zoom: 20 µm. (B,C) Quantitative analysis of the picrosirius red-stained area in the heart sections of PBS or AngII injected animals at 7 dpi (6 each from 2 independent experiments) (B) and 14 dpi (4 each from 2 independent experiments) (C). From each heart, 8–10 sections were analyzed for quantification. The mean of control was considered to be 100%. (D) Quantitative analysis of collagen and fibrosis marker gene expression in cardiac ventricles from PBS or AngII injected animals at 7 dpi (n = 3, each sample represents a pool of 6 hearts). Error bars indicate the mean ± s.e.m. values in (D) are normalized to the mean of the PBS control. Dpi: days post-injection. Significant, p < 0.05; non-significant, p ≥ 0.05.