
- Title
-
Pericardial Injection of Kainic Acid Induces a Chronic Epileptic State in Larval Zebrafish
- Authors
- Heylen, L., Pham, D.H., De Meulemeester, A.S., Samarut, É., Skiba, A., Copmans, D., Kazwiny, Y., Vanden Berghe, P., de Witte, P.A.M., Siekierska, A.
- Source
- Full text @ Front. Mol. Neurosci.
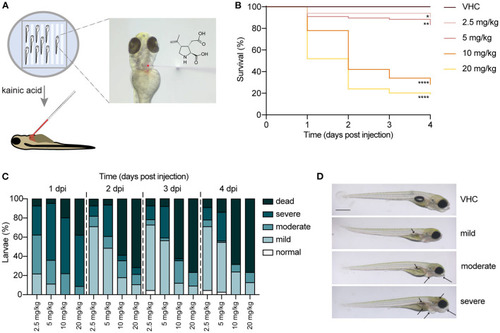
Injection of kainic acid into the bloodstream of 3 days post fertilization (dpf) zebrafish larvae. (A) A scheme of the set-up of kainic acid (KA) injection into 3 dpf zebrafish larvae. The larvae were anesthetized in 0.4 mg/mL tricaine and aligned in an agarose mold (left panel). KA mixed with dextran rhodamine B used as a tracer was injected into the zebrafish pericardium (right panel). (B) Survival of the larvae injected with 2.5, 5, 10, 20 mg/kg KA and vehicle (VHC) as a control. Significant larval death can be observed in a time-dependent manner. Statistical analysis between different doses injected was performed using Log-rank (Mantel-Cox) test (*p < 0.05, **p < 0.01, ****p < 0.0001). Data pooled from three independent experiments, total numbers include: VHC n = 60, KA 2.5 mg/kg n = 50, KA 5 mg/kg n = 84, KA 10 mg/kg n = 61, KA 20 mg/kg n = 83. (C) Quantification of morphological abnormalities after injection of 2.5, 5, 10 and 20 mg/kg of KA from 1 until 4 days post injection (dpi). Larval phenotype was classified in function of number of malformations—normal, mild, moderate and severe. The graphs include the percentage of dead larvae. Data were pooled from three independent experiments, total numbers include: VHC n = 60, KA 2.5 mg/kg n = 50, KA 5 mg/kg n = 84, KA 10 mg/kg n = 61, KA 20 mg/kg n = 83. (D) Representative images of KA-injected larvae showing normal, mild, moderate and severe phenotypes. Mild or moderate abnormalities included predominantly lack of swim bladder, while severe abnormalities consisted of jaw malformation, pericardial edema and yolk sac edema. Arrows indicating morphological abnormalities (lack of swim bladder, jaw malformation, pericardial edema, yolk sac edema, opaque brain). Scale bar 500 μm. PHENOTYPE:
|

Injection of kainic acid in zebrafish larvae results in acute brain inflammation and apoptosis. (A) LC-MS/MS analysis of kainic acid (KA) levels in larval heads after injection of KA after 15 min post injection (mpi), 2 h post injection (hpi) and 1–4 days post injection (dpi) demonstrating stable levels of KA in zebrafish head tissues during each experimental timepoint. Maximal signal (%) refers to the highest signal found among measured samples. Data from four independent experiments are presented as mean ± s.d. (B) Representative images of VHC- and KA-injected larvae at 2–3 hpi upon 2 dpi. Characteristic opaque brain tissue was noticeable after 2–3 hpi and persisted mainly until 1 dpi. Red arrows mark the brain lesions. Scale bar 500 μm. (C) Quantification of larvae (%) with opaque brain at 1–4 dpi. All KA-injected larvae displayed opaque brain after 2–3 hpi (data not shown) and after 24 h still >80% of the larvae (***p < 0.001 compared to VHC determined immediately after injection [0%]) had this phenotype. Brain tissue cleared out during the following days. Means were pooled from three independent experiments, total number of larvae per condition: VHC n = 60, KA n = 84. Data are presented as mean ± s.d. Statistical analysis was performed using ordinary one-way Anova with Bonferroni's multiple comparison test. (D,E) Quantification of the expression levels of apoptosis (D) and inflammatory (E) markers in the heads of KA-injected larvae at 3 hpi, 1 dpi and 2 dpi by qPCR. Data were presented as fold expression to VHC-injected larvae at the respective timepoints (dotted line). Data from three independent experiments are presented as mean ± s.d. Statistical analysis was performed using ordinary one-way Anova with Bonferroni's multiple comparison test (*p < 0.05, **p < 0.01, ***p < 0.001, ****p < 0.0001 compared to VHC set to a 1-fold expression). EXPRESSION / LABELING:
PHENOTYPE:
|
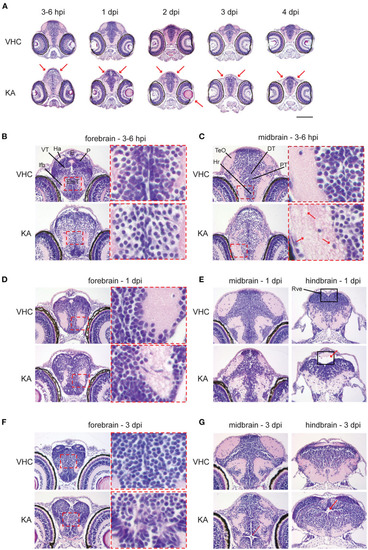
Histopathological analysis reveals that kainic acid (KA) injection induces whole brain abnormalities. Representative images of hematoxylin and eosin (H&E) staining on paraffin cross-brain sections of KA-injected larvae in comparison to VHC-injected siblings. (A) Abnormal brain shape was observed at 2–3 hpi until 4 dpi, marked with red arrows. Scale bar 500 μm. Selected brain abnormalities in KA-injected larvae from different parts of the brain at 3–6 hpi (B,C), 1 dpi (D,E) and 3 dpi (F,G). Red rectangles and arrows highlight the histopathological changes and its magnification. DT, dorsal thalamus; E, epiphysis; EmT, eminentia thalami; Ha, habenula; Hr, rostral hypothalamus; lfb, lateral forebrain bundle; P, pallium; PT, posterior tuberculum; Rve, rhombencephalic ventricle; TeO, optic tectum; VT, ventral thalamus. PHENOTYPE:
|
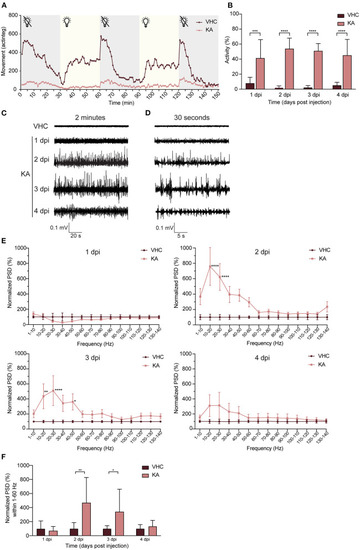
Kainic acid injected larvae display seizure-like behavior and continuous epileptiform discharges as measured by non-invasive local field potential recordings. (A) Decreased locomotor activity of KA-injected larvae at 3 dpi (n = 25) during interchanged dark and light periods of 30 min during 150 min in comparison to VHC-injected controls (n = 18). Error bars were not displayed for the sake of clarity. (B) Analysis of seizure-like behavior of KA-injected larvae at 1–4 dpi in comparison to VHC-injected age-matched controls by quantification of tail twitching. Total number of larvae per condition: 1 dpi VHC n = 10, KA n = 14; 2 dpi VHC n = 11, KA n = 11; 3 dpi VHC n = 14, KA n = 12; 4 dpi VHC n = 10, KA n = 14. At each time point KA-injected larvae displayed statistically significant increase in seizure-like behavior compared to VHC (***p < 0.001, ****p < 0.0001). Data are presented as mean ± s.d. Statistical analysis was performed using unpaired t-test. (C) Two-min representative local field potential (LFP) recordings from VHC- and KA-injected larvae at 1–4 dpi. Note the continuous epileptiform discharges in case of KA-injected larvae at 2–4 dpi. (D) Thirty-s magnification of the corresponding LFP recordings from (C). (E) Power spectral density (PSD) analysis of KA and VHC-injected larvae at 1–4 dpi. No epileptiform brain activity could be observed in KA-injected larvae at 1 dpi, abnormal brain discharges appeared starting from 2 dpi. At 2 dpi and 3 dpi there was a statistically significant increase in PSD values in comparison to VHC-injected larvae. At 4 dpi, PSD values increased as well, however not significant. Results were normalized to VHC-injected larvae as 100%. Total number of larvae per condition: 1 dpi VHC n = 11, KA n = 10; 2 dpi VHC n = 10, KA n = 10; 3 dpi VHC n = 10, KA n = 10; 4 dpi VHC n = 9, KA n = 9. Statistical analysis was performed using two-way Anova with Sidak's multiple comparisons test (*p < 0.05, **p < 0.01, ****p < 0.0001 compared to VHC). (F) Mean PSD values plotted per condition over the 1–60 Hz region for VHC- and KA-injected larvae. Statistically significant increases in mean PSD values compared to VHC were observed for 2 dpi (**p < 0.01) and 3 dpi (*p < 0.05). Data are presented as mean ± s.d. Statistical analysis was performed using unpaired t-test. PHENOTYPE:
|
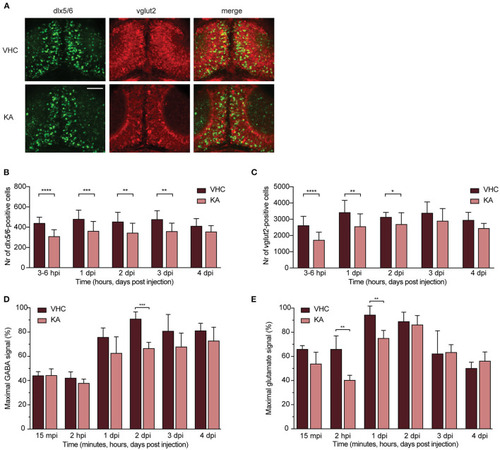
GABAergic and glutamatergic neuronal populations and neurotransmitters levels in kainic acid-injected larvae demonstrate a decrease. (A) Representative images of the GABAergic and glutamatergic neurons in transgenic reporter lines in 3–6 hpi VHC- and KA-injected larvae. Scale bar 50 μm. (B) Statistically significant decrease in the number of dlx5/6-positive cells was observed from 3–6 hpi until 3 dpi (**p < 0.01, ***p < 0.001, ****p < 0.0001). (C) Statistically significant decreases in the number of vglut2-positive cells were observed from 3–6 hpi until 2 dpi (*p < 0.05, **p < 0.01, ****p < 0.0001). Data in (B,C) are presented as mean ± s.d. Total number of larvae per condition: 3–6 hpi VHC n = 20, KA n = 15; 1 dpi VHC n = 17, KA n = 16; 2 dpi VHC n = 16, KA n = 18; 3dpi VHC n = 13, KA n = 14; 4 dpi VHC n = 6, KA n = 6. Statistical analysis was performed using unpaired t-test. LC-MS/MS analysis of GABA (D) and glutamate (E) levels in the larval brains at 15 mpi, 2 hpi and 1–4 dpi. (D) Statistical reduction in GABA levels between VHC- and KA-injected larvae was observed at 2 dpi (***p < 0.001), (E) while in glutamate levels at 2 hpi (**p < 0.01) and 1 dpi (**p < 0.01). Maximal signal (%) in (D,E) refers to the highest signal found among measured samples per each neurotransmitter. Data from four independent experiments are presented as mean ± s.d. Statistical analysis was performed using unpaired t-test. EXPRESSION / LABELING:
PHENOTYPE:
|
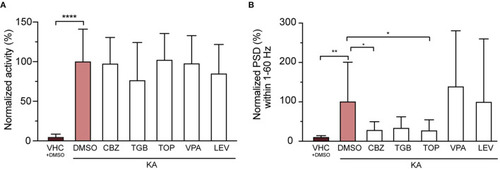
Three out of five tested anti-epileptic drugs (AEDs) rescue epileptiform brain discharges but not seizure-like behavior. (A) Quantification of seizure-like behavior at 3 dpi after incubation of VHC- and KA-injected larvae with commonly used AEDs or DMSO control for 24 h. None of the tested compounds decreased seizure-like behavior (tail twitching). Values were normalized to KA-injected controls treated with 1% DMSO as 100%. Total number of larvae per condition: VHC + DMSO n = 20, KA + DMSO n = 18, KA + CBZ n = 15, KA + TGB n = 15, KA + TOP n = 15, KA + VPA n = 15, KA + LEV n = 12. Data are presented as mean ± s.d. Statistical analysis was performed using ordinary one-way Anova with Bonferroni's multiple comparison test (****p < 0.0001). (B) Mean power spectral density (PSD) values from LFP recordings at 3 dpi plotted per condition over the 1–60 Hz region for VHC- and KA-injected larvae after incubation with AEDs or DMSO control for 24 h. Values were normalized to KA-injected controls treated with 1% DMSO as 100%. CBZ (*p = 0.04), TGB (ns, p = 0.05) and TOP (*p = 0.03) decreased epileptiform brain activity in KA-injected larvae (VHC **p = 0.001), while VPA and LEV did not have any effect. Total number of larvae per condition: VHC + DMSO n = 18, KA + DMSO n = 38, KA + CBZ n = 15, KA + TGB n = 14, KA + TOP n = 14, KA + VPA n = 11, KA + LEV n = 12. Data are presented as mean ± s.d. Statistical analysis was performed using ordinary one-way Anova with Bonferroni's multiple comparison test. CBZ, carbamazepine; TGB, tiagabine; TOP, topiramate; VPA, valproic acid; LEV, levetiracetam. PHENOTYPE:
|

Timeline depicting multiple stages of epileptogenic processes observed in KA larval zebrafish model. After KA injection, immediate brain damage and acute inflammation could be observed at 3 hpi. This was followed by a delay period, where apoptosis, neuroinflammation and neuronal reorganization occurred. Finally, KA-injected larvae displayed spontaneous recurrent brain discharges. |