
- Title
-
The chromatin-remodeling enzyme Smarca5 regulates erythrocyte aggregation via Keap1-Nrf2 signaling
- Authors
- Ding, Y., Li, Y., Zhao, Z., Cliff Zhang, Q., Liu, F.
- Source
- Full text @ Elife
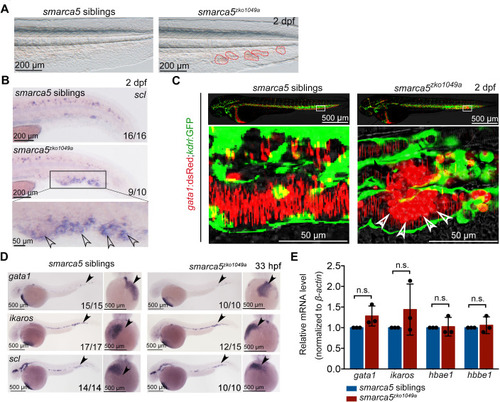
(A) The bright-field of tail region in smarca5zko1049a and their siblings at 2 days post fertilization (dpf). The areas circled by red dotted line show the blood clots in the caudal vein plexus. (B) Expression of scl at 2 dpf in smarca5zko1049a and their siblings by WISH. The amplification region in the black rectangular box in CHT shows the enriched expression of scl in blood clots (indicated by arrow heads) in the caudal vein plexus. (C) The confocal imaging of transgenic line (Tg) (gata1:dsRed;kdrl:GFP) in smarca5zko1049a and their siblings at 2 dpf. The amplification region in the white rectangular box in CHT shows the coagulation of red blood cells (RBCs) (indicated by arrow heads) in the caudal vein plexus. (D) Expression of gata1, ikaros and scl at 33 hr post fertilization (hpf) in smarca5zko1049a and their siblings by WISH. (E) qPCR analysis showing the expression of gata1, ikaros, hbae1, and hbbe1 in smarca5zko1049a and their siblings at 33 hpf. The expression level of these genes in smarca5 siblings was set at 1. Data are mean ± s.d. (E). Asterisk presents statistical significance (n.s. not significant). p Values were calculated by two-tailed unpaired Student’s t-test.
|
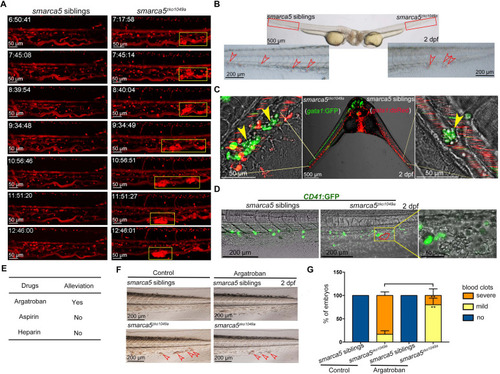
(A) The snapshot of Tg (gata1:dsRed) in smarca5zko1049a and their siblings from 36 hpf to 2 dpf. The yellow rectangular boxes in CHT show the formed blood clots smarca5zko1049a. (B) The bright-field of parabiosis at 2 dpf between smarca5zko1049a and their siblings. The amplification region in the red rectangular box in CHT shows the blood clots (indicated by arrow heads) in smarca5zko1049a and their siblings. (C) The confocal imaging of parabiosis generated between smarca5zko1049a and their siblings with Tg (gata1:GFP) and Tg (gata1:dsRed) background, respectively. The magnification in CHT shows the aggregation of gata1:GFP+ cells (indicated by arrow heads) in the caudal vein plexus. (D) The confocal imaging of Tg (CD41:GFP) in smarca5zko1049a and their siblings at 2 dpf. The magnification in the yellow rectangular box in CHT shows the blood clots and the distribution of CD41:GFP+ cells. (E) Drugs used to examine whether the blood clots in smarca5zko1049a can be alleviated. (F) The bright-field of tail region in smarca5zko1049a at 2 dpf in control group and with argatroban treatment. The blood clots are indicated by arrow heads. (G) The quantification of blood clots phenotype in (F). Data are mean ± s.d. (G). Asterisk presents statistical significance (**p< 0.01). p Values were calculated by two-tailed unpaired Student’s t-test.
|

(A) The transmission electron microscopy (TEM) view of a longitudinal section through the artery and vein plexus in sibling tail region at 2 dpf. (B) TEM view of erythrocytes in sibling embryos. The red arrow heads indicate the characteristic pattern of organization in mitochondria. (C) TEM view of a longitudinal section through the artery and vein plexus in smarca5zko1049a tail region at 2 dpf. (D) The blue rectangular box showing blood clots in the caudal vein plexus in smarca5zko1049a. The magnification of blood clots is shown (right). (E) TEM view of erythrocytes in smarca5zko1049a. The red arrow heads indicate the characteristic pattern of organization in mitochondria. The disintegration of cristae in mitochondria is observed in smarca5-deficient RBCs. Ery, erythrocyte; EC, endothelial cell; Mito, mitochondria; Nuc, nucleus; Cyto, cytoplasm. (F) Scatter plots showing the section area of mitochondria relative to cell in RBCs from smarca5zko1049a and their siblings. (G) Scatter plots showing the number of mitochondria per cell section in RBCs from smarca5zko1049a and their siblings. Data are mean ± s.d. (F and G). Asterisk presents statistical significance (n.s. not significant). p Values were calculated by two-tailed unpaired Student’s t-test.
|
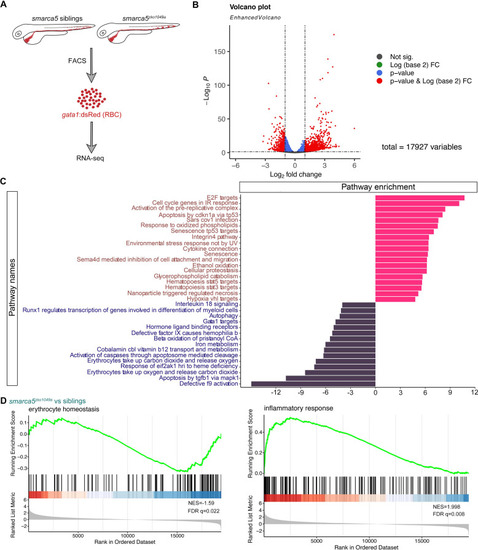
(A) Schematic representation of the RBC RNA-seq workflow in smarca5zko1049a and their siblings at 2 dpf. (B) Volcano plot showing differential expression genes between RBCs from smarca5zko1049a and their siblings by DESeq2. −Log10 P, negative log10 adjusted p-value. Adjusted p-value < 0.05, log2 fold change >1. (C) Differential pathways enriched in RBCs from smarca5zko1049a and their siblings by GSVA. The x axis represents the t values of GSVA scores. Two-sided unpaired limma-moderated t test. (D) Enrichment plots for the top pathways in the mutant RBCs by GSEA (Gene Set Enrichment Analysis).
|
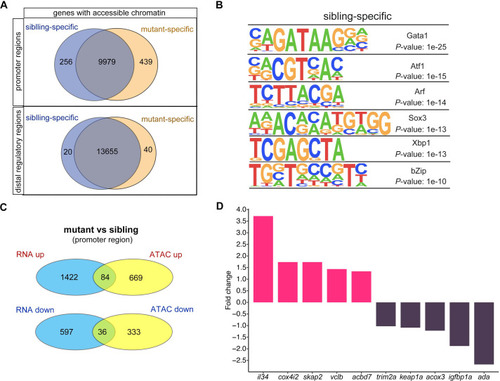
(A) Venn plot showing the genes of sibling and mutant specific accessible chromatin regions at promoter and distal regulator regions, respectively. (B) Motifs enriched in nucleosome-free regions (NFRs) with lost accessibility after smarca5 deletion. (C) Venn plot showing the overlap of genes with specific accessible chromatin at promoter regions and upregulated expression in mutant (top) and sibling (bottom) RBCs, respectively. Genes for ATAC-seq were assigned by differential accessible regions. (D) Bar plot showing the selected sibling and mutant-specific differential expression genes. Fold change, log2 fold change.
|

(A) The browser views showing the ATAC-seq peaks in keap1a promoter with in smarca5zko1049a and their siblings. Gray box indicates the change of ATAC-seq peaks after smarca5 deletion. The location of Gata1 motif at keap1a promoter is indicated by arrow. (B) qPCR analysis showing the expression of keap1a in RBCs from smarca5zko1049a and their siblings at 2 dpf. (C) qPCR analysis showing the expression of hmox1a, gclc, ggt1b, gsr, gstp1, gstk1, fbp1a, gsto2, prdx1, pgd and g6pd in RBCs from smarca5zko1049a and their siblings at 2 dpf. (D) The imaging of EGFP fluorescence in Tg (hsp70:keap1a-EGFP) embryos at 2 dpf. Heat shock was performed at 36 hpf. The bright-field of tail region in smarca5zko1049a and their siblings, with or without Smarca5 overexpression at 2 dpf. (E) The quantification of blood clots phenotype in (D). (F) The bright-field of tail region in smarca5zko1049a and their siblings, in control group and with hmox1a MO injection. The blood clots are indicated by arrow heads. (G) The quantification of blood clots phenotype in (F). (H) Schematic representation of Smarca5 in regulating erythrocyte aggregation via Keap1-Nrf2 signaling. In cytoplasm, Keap1 could anchor to Nrf2 to facilitate the Nrf2 degradation, while the release of Nrf2 to the nucleus could activate the expression of oxidation defense factors. In smarca5-deficient RBCs, the chromatin accessibility at keap1a promoters and the transcription of keap1a were decreased, which led to the excessive activation of hmox1a. Data are mean ± s.d. (B, C, E, G). Asterisk presents statistical significance (*p < 0.05, **p < 0.01, ***p < 0.001, n.s. not significant). p Values were calculated by two-tailed unpaired Student’s t-test.
|