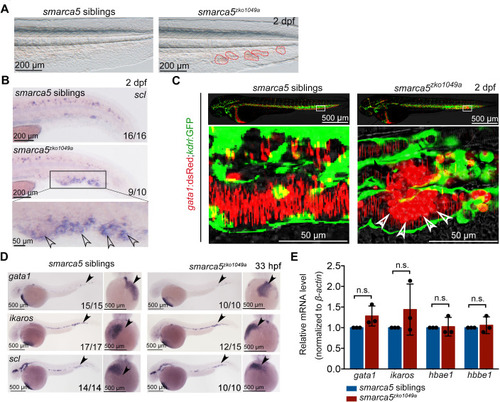
(A) The bright-field of tail region in smarca5zko1049a and their siblings at 2 days post fertilization (dpf). The areas circled by red dotted line show the blood clots in the caudal vein plexus. (B) Expression of scl at 2 dpf in smarca5zko1049a and their siblings by WISH. The amplification region in the black rectangular box in CHT shows the enriched expression of scl in blood clots (indicated by arrow heads) in the caudal vein plexus. (C) The confocal imaging of transgenic line (Tg) (gata1:dsRed;kdrl:GFP) in smarca5zko1049a and their siblings at 2 dpf. The amplification region in the white rectangular box in CHT shows the coagulation of red blood cells (RBCs) (indicated by arrow heads) in the caudal vein plexus. (D) Expression of gata1, ikaros and scl at 33 hr post fertilization (hpf) in smarca5zko1049a and their siblings by WISH. (E) qPCR analysis showing the expression of gata1, ikaros, hbae1, and hbbe1 in smarca5zko1049a and their siblings at 33 hpf. The expression level of these genes in smarca5 siblings was set at 1. Data are mean ± s.d. (E). Asterisk presents statistical significance (n.s. not significant). p Values were calculated by two-tailed unpaired Student’s t-test.