
- Title
-
Satb2 acts as a gatekeeper for major developmental transitions during early vertebrate embryogenesis
- Authors
- Pradhan, S.J., Reddy, P.C., Smutny, M., Sharma, A., Sako, K., Oak, M.S., Shah, R., Pal, M., Deshpande, O., Dsilva, G., Tang, Y., Mishra, R., Deshpande, G., Giraldez, A.J., Sonawane, M., Heisenberg, C.P., Galande, S.
- Source
- Full text @ Nat. Commun.
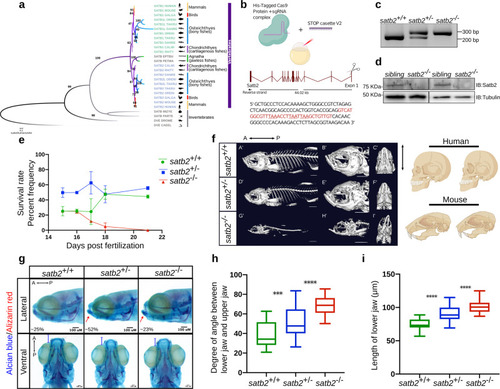
a Phylogenetic tree depicting evolution and divergence of SATB family proteins. SATB1 homologues are highlighted in green, SATB2 in blue whereas ancestors of SATB proteins are in gray. Organisms belonging to different classes are highlighted with different colors. Numbers on branching points represent bootstrap values. Organism labels: HUMAN- Homo sapiens, MOUSE- Mus musculus, GALGAL- Gallus gallus, ORENI- Oreochromis niloticus, TAKRU- Takifugu rubripes, DANRE- Danio rerio, CALMI- Callorhinchus milii, RHITY- Rhincodon typus, EPTBU- Eptatretus burger, PETMA- Petromyzon marinus, MIZYE- Mizuhopecten yessoensis, PARTE- Parasteatoda tepidariorum, DROME- Drosophila melanogaster and CAEEL- Caenorhabditis elegans. Additional copies of SATB1 and SATB2 were denoted with SATB1L (SATB1-like) and SATB2L (SATB2-like). b Schematic of CRISPR-Cas9 mediated mutant generation by introducing the STOP cassette (highlighted in red) in exon1 of the satb2 gene resulting in loss of function mutant allele. c Identification of mutant allele by genotyping (60 bp insertion). N = 5 independent biological experiments. d Confirmation of loss of Satb2 between siblings and homozygous larvae at 48 hpf by immunoblot. Tubulin was used as a loading control. N = 3 independent biological experiments. e Lifespan analysis of zygotic satb2 mutants depicted as a percentage frequency of individual genotype from a pool of larvae screened (incross of satb2+/−) by a line graph. Wild-type (green), Heterozygous (blue), and Homozygous mutants (Red). Error bar represents ±S.D. of two independent biological experiments with n = 48 larvae. f Micro CT images of adult zebrafish (4-month old) to visualize defects in skeletal and craniofacial structures. Lateral view A’, D’, G’, magnified lateral view B’, E’, H’ and ventral view C’, F’, I’ of wild type, heterozygous and mutant for Satb2 respectively are shown. Ventral view images are not scaled to attain a maximum field of view highlighting detailed structural deformities independent of the size of the fish. Image is a representative of N = 5 individual organisms. Scale bar = 5 mm. Corresponding schematics on the right depicting similarity with SATB2 mutation reported in humans and mice. g Alcian blue/Alizarin red staining to visualize craniofacial defects at early larval stages, 15 dpf. Abnormal jaw protrusion in heterozygous and homozygous mutants is indicated by a red arrow. Numbers in respective boxes signify the percentage of the larvae from the total population showing class of phenotype and genotype correlation. Scale bar = 100 µm. h Degrees of the angle between the lower jaw and upper jaw. *** indicates p-value = 0.002 and **** indicates p-value of significance 0.0001 as determined by the student’s two-tailed t-test. The whiskers show the minima to the maxima values and the central line indicates the median, satb2+/+, (n = 24) 38.04, satb2+/−, (n = 50) 52.14, satb2−/−, (n = 22) 68.57 over three independent biological experiments. i Total length of protrusion measured from ventral view as indicated in g, are plotted using a box plot. **** indicates p-value of significance 0.0001 as determined by the student’s two-tailed t-test. The whiskers show the minima to the maxima values and the central line indicates the median, satb2+/+, (n = 26) 74.68, satb2+/−, (n = 48) 90.25, satb2−/−, (n = 22) 102.0 over three independent biological experiments. PHENOTYPE:
|
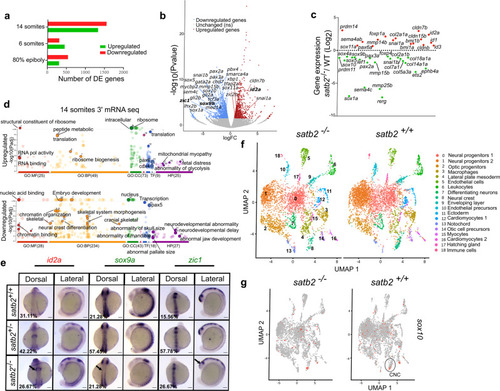
a Bar plot for the number of upregulated (red) and downregulated (green) genes from 3′ mRNA-seq datasets at the respective stages. b Volcano plot of differentially expressed genes at 14 ss embryonic stage. DE genes with FDR < 0.1 and log2 fold change > ±0.58 are colored as red for significantly upregulated, blue for significantly downregulated, and gray for unchanged or non-significant genes. Few significantly differentially expressed genes representing GO categories neural crest differentiation, neurogenesis, and cranial skeletal system development are highlighted. c Scatter plot for log2 fold change in gene expression of various gene families belonging to the above-mentioned GO categories. d GO analysis of dysregulated genes at 14 ss highlighting significant classes under molecular function (MF), biological processes (BP), cellular components (CC), transcription factors (TF) and human pathology (HP) categories. e Dorsal and lateral view of WISH for id2a (upregulated) n = 48, N = 3; sox9a, n = 47, N = 3 and zic1, n = 45, N = 3 (downregulated). Arrows in the respective images mark the region of maximum differences in the expression pattern. Scale bar = 100 µm. f UMAP clusters illustrate 19 distinct cell types through integrated scRNAseq analysis on satb2−/− and satb2+/+ embryos at 14 ss. g UMAP highlighting (circled) cranial neural crest cells cluster expressing sox10. EXPRESSION / LABELING:
PHENOTYPE:
|
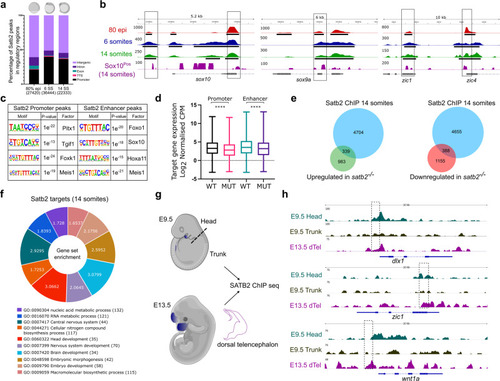
a Genome-wide distribution pattern of Satb2 occupancy in the regulatory regions. percentage of peaks overlapping with OCR at 80% epiboly, 6 ss, and 14 ss. Numbers in the brackets indicate the total number of Satb2 peaks at the corresponding developmental stage. Annotation was performed using HOMER, core promoter region was defined as ±2 kb from TSS. TTS, Exon, and Intron annotations were used from HOMER analysis. The remaining peaks were annotated as Intergenic peaks. b Integrative genomics viewer (IGV) snapshot of Satb2 occupancy on genomic loci of sox10, sox9a, and zic1 at 80 % epiboly (red), 6 ss (blue), 14 ss (green), and in Sox10Pos (purple) cells. Input subtracted tracks are used for visualization. For Satb2 ChIPseq in Sox10Pos (neural crest) cells, ChIPseq reads are normalized to signal from Sox10Neg (non-neural crest) cells to depict enrichment at respective gene loci. Solid line boxes highlight enriched genomic regions across all the datasets. Black colored blocks represent enriched regions determined by the peak calling algorithms. c Motif enrichment analysis for Satb2 binding sites at the promoter (±2 kb) and enhancer regions (overlapping with H3K4me1 binding sites) matched to known motif sets of danRer10 genome assembly. d Box plots indicating log2 normalized gene expression (Counts Per Million) of promoter- and enhancer- bound genes in wild-type and satb2−/− mutants at 14 ss. N = 2 biologically independent experiments. **** indicates p-value of significance 0.0001 as determined by the student’s two-tailed t-test. Error bar represents ±SEM. The whiskers show the minima to the maxima values and the central line indicates the median, WT promoter (n = 4178): 3.347, MUT promoter (n = 4149): 2.890, WT enhancer (n = 3337): 3.662, MUT enhancer (n = 3327): 3.281. e Venn analysis depicting the overlap between Satb2 bound genes and differentially regulated genes at 14 somites in the satb2−/− mutant. f GO analysis for biological processes of Satb2 occupied genes at 14 ss. Numbers for each category of doughnut plot represent enrichment ratio, FDR < 0.05. g Schematic of dissections performed for the ChIP-seq experiment in mouse embryos at E9.5 (head and trunk) and E13.5 (dorsal telencephalon). Dotted line represents the site of the incision. h, IGV snapshot of mouse SATB2 occupancy profile on the genomic loci of dlx1, zic1, and wnt1. Dashed line boxes highlight enriched regions in E9.5 head and E13.5 dTel which are absent in the E9.5 trunk region. |
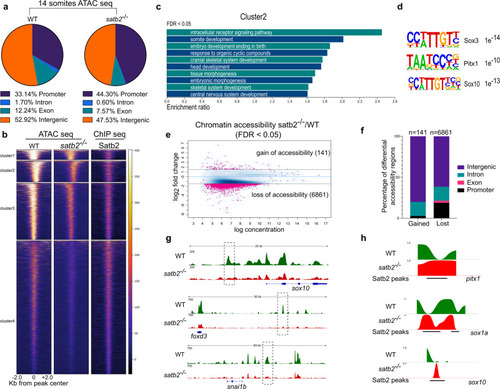
a Genomic distribution of ATAC-seq peaks in wild type and satb2−/− mutant at 14 ss as a percentage of the total. Annotation was performed using HOMER, core promoter region was defined as ±2 kb from TSS. TTS, Exon, and Intron annotations were used from HOMER analysis. The remaining peaks were annotated as Intergenic peaks. b Heatmaps for clustering (K-means 4) of chromatin accessibility around ±2 kb of Satb2 ChIP-seq peak regions. Colorbar represents the degree of chromatin accessibility from low (blue) to high (white). c GO analysis of cluster 2 highlighting biological processes involved in neural and craniofacial development. d Enriched TFBS are represented for cluster 2. e Differential chromatin accessibility between wild-type and satb2−/− mutant embryos represented as binding affinity (FDR < 0.05). Y-axis represents log2 fold change. Regions with log2 fold (>±0.58) were considered significant and marked by solid lines. f Genome-wide distribution of differentially gained or lost regions in satb2−/− mutant embryos represented as a percentage. g IGV snapshot of ATAC-seq peaks over the genomic loci for enhancer regions of neural crest markers sox10, foxd3 and snai1b. Dashed line boxes highlight regions that are identified as differentially expressed through Diffbind analysis. h Nucleosome occupancy profile calculated using ATAC-seq showing changes in nucleosome phasing at Satb2 regulatory sites for pitx1, sox1a and sox10. PHENOTYPE:
|

a Stage-specific gene expression analysis highlighting bi-phasic expression of Satb2 during MZT and organogenesis. Normalized CPM values for each stage are used for the analysis [GSE32900]. N = 2 biologically independent experiments. Error bar represents ±SD. b Lateral view of zebrafish embryos at 6 hpf injected with 200 pg eGFP (Mock) and 3xFlag-satb2 mRNA (Satb2 OE). Scale bar = 100 µm. N = 4 biologically independent experiments. c GO analysis for differentially expressed genes upon over-expression of Satb2 at 4.5 hpf. Significant ontologies under molecular function (MF), biological processes (BP), cellular components (CC), reactome (REAC), transcription factors (TF), and human pathology (HP) categories are highlighted. Numbers in brackets signify the total number of ontologies enriched under each category. d Relative expression values for genes involved in neural crest differentiation upon morpholino mediated depletion of maternal Satb2 (yellow circles) analyzed at 4.5 hpf and in zygotic satb2−/− mutants (red triangles) analyzed at 14 ss, highlighting opposite effects on gene regulation by maternal and zygotic forms of Satb2 (FDR < 0.1). e Experimental strategy for single-cell analysis of embryos with mosaic overexpression of Satb2 at 4.5 hpf. UMAP clustering illustrates eight different clusters based on gene expression patterns from 8483 single cells. f FeaturePlots for exemplifying negative correlation between cells expressing satb2 (blue) and zygotic factors ta, mixl1, krt8, and aplnrb (red). g Biplot depicting the effect of overexpression of Satb2 on maternal (green), zygotic (blue) and first wave zygotic genes (red). log2 CPM values are used for the analysis. The dotted line marks genes that show more than 1.5-fold differences in log2 CPM values. Inset is a zoomed version to highlight the differences. h Average mean density profiles around ±2 kb region around TSS of ‘zygotic genes’ for H3K4me3 (activation mark), H3K27me3 (repressive mark), H3K27Ac (activation mark) and ATAC-seq (chromatin accessibility) upon Satb2 overexpression (red) compared to control (green). EXPRESSION / LABELING:
PHENOTYPE:
|
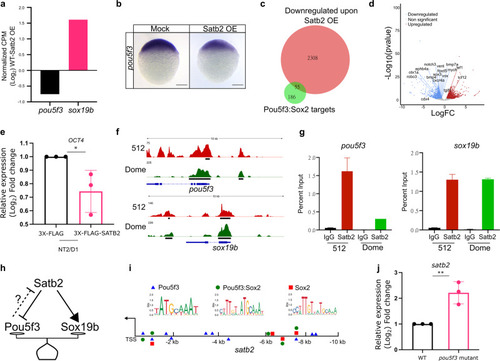
a Relative gene expression for pou5f3 and sox19b as determined by RNA-seq analysis (FDR < 0.05). b Lateral view of zebrafish embryo at 4 hpf for WISH using RNA probe against pou5f3 in control and Satb2 overexpressing embryos, n = 24, N = 3 biologically independent experiments Scale bar = 100 µm. c Venn diagram analysis showing the overlap between negative targets of Satb2 and known genomic targets of Pou5f3 and Sox2. d Volcano plot of differentially expressed genes upon overexpression of Satb2 analyzed at 4.5 hpf. DE genes with FDR < 0.1 and log2 fold change > ±0.58 are colored as red for upregulated, blue for downregulated, and gray for unchanged or non-significant genes. Key Pou5f3: Sox2 target genes are labeled. e Quantitative RT-PCR analysis of OCT4 (human homologue of pou5f3) expression in NT2/D1 cells upon overexpression of SATB2 as compared to FLAG overexpression. * Signifies P-value 0.049 as calculated by the unpaired Student’s two-tailed t-test, N = 3 biologically independent experiments. Error bar represents ±SEM. f IGV snapshot of Satb2 ChIP-seq at 512 cells (red) and Dome stages (green) on genomic loci of pou5f3 and sox19b. g Quantitative relative enrichment (ChIP-qPCR) represented as percent input using isotype-matched IgG and anti-Satb2 antibody for genomic locus (TSS) of pou5f3 and sox19b. ** indicates P-value < 0.001 as calculated by the Student’s two-tailed t-test, N = 2. h The predictive regulatory model between maternal Satb2 and pioneer factors during the establishment of ZGA. i Schematic for satb2 promoter displaying motif sites marked for Pouf53, Pou5f3: Sox2 and Sox2. j qPCR analysis for satb2 expression at 4.5 hpf in pou5f3 mutant embryos. ** Signifies P-value < 0.0082 as calculated by the unpaired Student’s two-tailed t-test, N = 3 biologically independent experiments. Error bar represents ±SEM. |
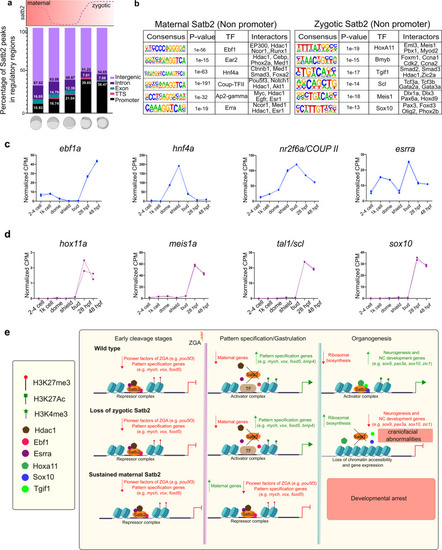
a Genomic distribution of Satb2 bound regions across developmental stages highlighting a shift in the ratio of non-promoter to promoter bound peaks. Schematic above the bar plot represents the expression pattern of satb2 throughout early embryogenesis. b TFBS for transcription factors at maternal (512 cells stage) and zygotic (14 ss) Satb2. Known interactors for each transcription factor are enlisted. c Line graph depicting mRNA expression dynamics for putative interactors of maternal Satb2; ebf1a, hnf4a, nr2f6a, and esrra across developmental stages as indicated on the x-axis. d Line graph depicting mRNA expression dynamics for putative interactors of zygotic Satb2 namely, hox11a, meis1a, tal1, and sox10, across developmental stages as indicated on the x-axis. e Schematic summary highlighting differential functions of Satb2 during various stages of zebrafish embryogenesis. |