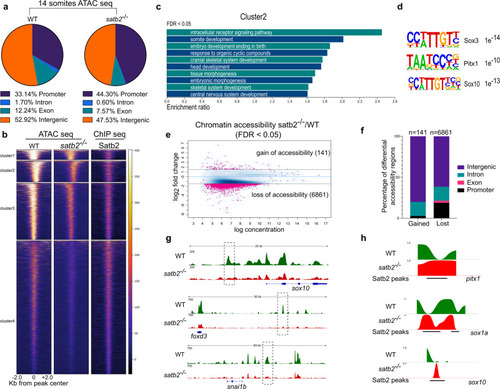
a Genomic distribution of ATAC-seq peaks in wild type and satb2−/− mutant at 14 ss as a percentage of the total. Annotation was performed using HOMER, core promoter region was defined as ±2 kb from TSS. TTS, Exon, and Intron annotations were used from HOMER analysis. The remaining peaks were annotated as Intergenic peaks. b Heatmaps for clustering (K-means 4) of chromatin accessibility around ±2 kb of Satb2 ChIP-seq peak regions. Colorbar represents the degree of chromatin accessibility from low (blue) to high (white). c GO analysis of cluster 2 highlighting biological processes involved in neural and craniofacial development. d Enriched TFBS are represented for cluster 2. e Differential chromatin accessibility between wild-type and satb2−/− mutant embryos represented as binding affinity (FDR < 0.05). Y-axis represents log2 fold change. Regions with log2 fold (>±0.58) were considered significant and marked by solid lines. f Genome-wide distribution of differentially gained or lost regions in satb2−/− mutant embryos represented as a percentage. g IGV snapshot of ATAC-seq peaks over the genomic loci for enhancer regions of neural crest markers sox10, foxd3 and snai1b. Dashed line boxes highlight regions that are identified as differentially expressed through Diffbind analysis. h Nucleosome occupancy profile calculated using ATAC-seq showing changes in nucleosome phasing at Satb2 regulatory sites for pitx1, sox1a and sox10.
|
