
Fig. 7
- ID
- ZDB-FIG-211118-63
- Publication
- Pradhan et al., 2021 - Satb2 acts as a gatekeeper for major developmental transitions during early vertebrate embryogenesis
- Other Figures
- All Figure Page
- Back to All Figure Page
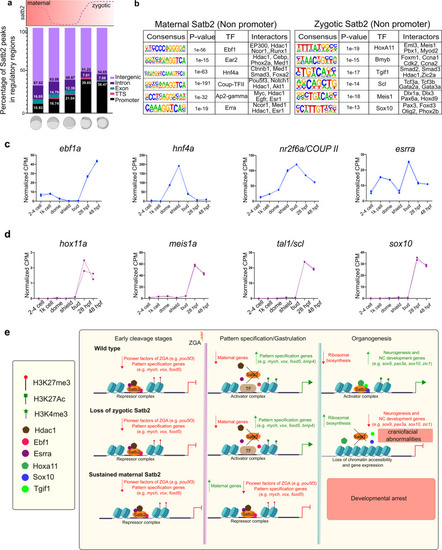
a Genomic distribution of Satb2 bound regions across developmental stages highlighting a shift in the ratio of non-promoter to promoter bound peaks. Schematic above the bar plot represents the expression pattern of satb2 throughout early embryogenesis. b TFBS for transcription factors at maternal (512 cells stage) and zygotic (14 ss) Satb2. Known interactors for each transcription factor are enlisted. c Line graph depicting mRNA expression dynamics for putative interactors of maternal Satb2; ebf1a, hnf4a, nr2f6a, and esrra across developmental stages as indicated on the x-axis. d Line graph depicting mRNA expression dynamics for putative interactors of zygotic Satb2 namely, hox11a, meis1a, tal1, and sox10, across developmental stages as indicated on the x-axis. e Schematic summary highlighting differential functions of Satb2 during various stages of zebrafish embryogenesis. |