
- Title
-
Protein kinase C family evolution in jawed vertebrates
- Authors
- Garcia-Concejo, A., Larhammar, D.
- Source
- Full text @ Dev. Biol.
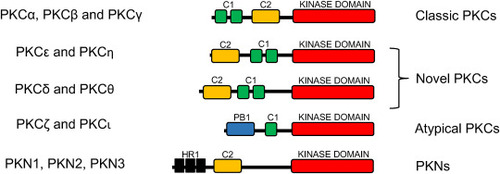
Fig. 1. Structure and classification of PKC subfamilies. The C1 domain, present in all subfamilies except for PKN, is formed by two zinc-finger motifs and is responsible for binding DAG and phorbol esters. The C2 domain (missing in the atypical PKCs) mediates calcium response. The PB1 domain, only present in the atypical PKCs, provides specificity during intracellular signaling. The HR1 domains, only found in the PKNs, mediate activation by Rho proteins. |
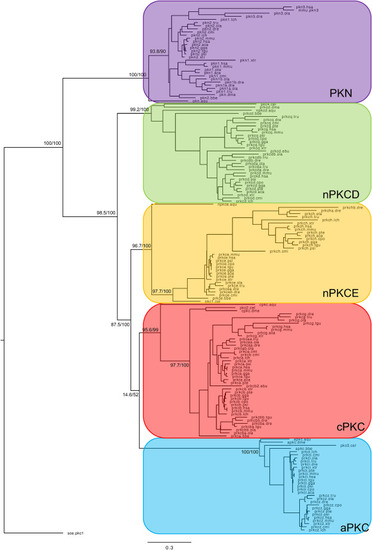
Fig. 2. Phylogenetic maximum likelihood tree of the PKC genes, rooted with the yeast PKC1 gene. The tree was generated using the kinase domain of each protein kinase. Each color corresponds to one PKC gene subfamily. Each subfamily contains a sequence from Amphimedon queenslandica, C. elegans and D. melanogaster. The tree topology is supported by a nonparametric Ultra-Fast Bootstrap (UFBoot) analysis. The complete tree values in Newick format are supported as supplementary data. |
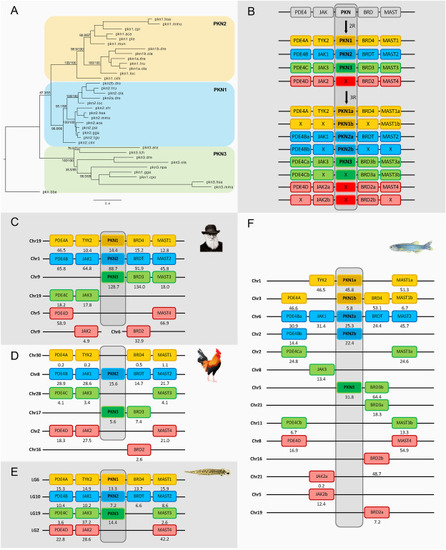
Fig. 3. Phylogenetic maximum likelihood tree of the PKN genes, rooted with the amphioxus PKN gene (A). Analysis of the evolution of the PKN family after 1R, 2R and 3R (B) with chromosomal locations of the PKN genes and their neighboring gene families in human (C), chicken (D), spotted gar (E) and zebrafish (F). Crosses indicate gene loss or gene not yet identified. The number below each gene shows the position in the chromosome. The order of the genes along the chromosomes has been adjusted to highlight the similarities. PKN1 was not found in any of the birds, but it is present in the reptiles. Two sequences annotated in ENSEMBL as PKN1 are in fact PKN3, namely chicken (marked as pkn1.gga) and Australian saltwater crocodile (pkn1.cpo) as shown in the tree. The tree topology is supported by a non-parametric Ultra-Fast Bootstrap (UFBoot) analysis. The full tree values in Newick format file can be downloaded as supplementary material. Each color field corresponds to one PKN ohnolog. Chicken and spotted gar illustrations are used with permission from Daniel Ocampo Daza, source: https://www.egosumdaniel.se and the human image is used with permission from https://commons.wikimedia.org. This paralogon is referred to as paralogon A in this study. |
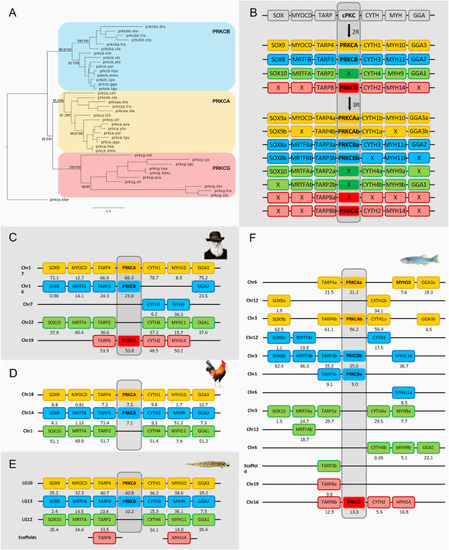
Fig. 4. Phylogenetic maximum likelihood tree of the cPKC genes, rooted with the amphioxus cPKC gene (prkca.bbe) (A) after 1R, 2R and 3R (B) with chromosomal locations of the cPKC genes and their neighboring gene families in human (C), chicken (D), spotted gar (E) and zebrafish (F). Crosses indicate gene loss or gene not yet identified. The number below each gene shows the position in the chromosome. The order of the genes along the chromosomes has been adjusted to highlight the similarities. Each color field corresponds to one cPKC ohnolog. PRKCG was found in the chicken as a pseudogene and thus it was not included in the analysis. The tree topology is supported by a non-parametric Ultra-Fast Bootstrap (UFBoot) analysis. The full tree values in Newick format file can be downloaded as supplementary material.Chicken and spotted gar illustrations are re-used with permission from Daniel Ocampo Daza, source: https://www.egosumdaniel.se and the human image is used with permission from https://commons.wikimedia.org. This paralogon is referred to as paralogon I in this study. |
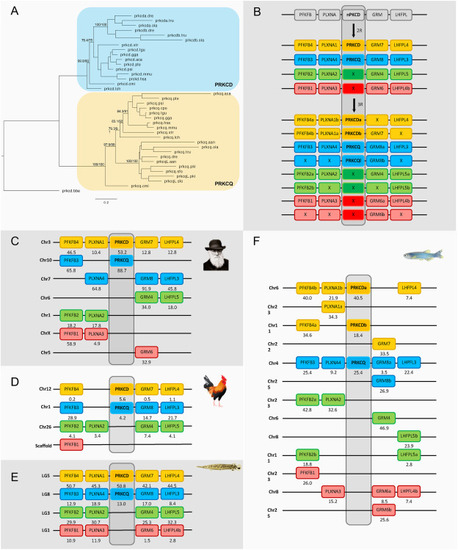
Fig. 5. Phylogenetic maximum likelihood tree of the nPKCd genes, rooted with the amphioxus nPKCd gene (prkcd.bbe) (A) after 1R, 2R and 3R (B) with chromosomal locations of the nPKCd genes and their neighboring gene families in human (C), chicken (D), spotted gar (E) and zebrafish (F). The tree topology is supported by a non-parametric Ultra-Fast Bootstrap (UFBoot) analysis. The full tree values in Newick format file can be downloaded as supplementary material. Crosses indicate gene loss or gene not yet identified. The number below each gene shows the position in the chromosome. The order of the genes along the chromosomes has been adjusted to highlight the similarities. Chicken and spotted gar illustrations are re-used with permission from Daniel Ocampo Daza, source: https://www.egosumdaniel.se and the human image is used with permission from https://commons.wikimedia.org. This paralogon is referred to as paralogon D in this study. |
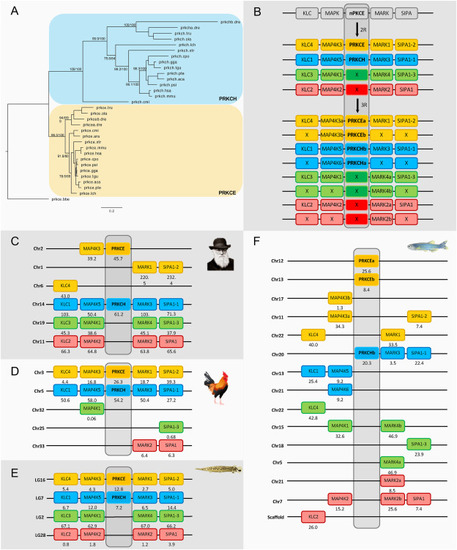
Fig. 6. Phylogenetic maximum likelihood tree of the nPKCe genes, rooted with the amphioxus nPKCe gene (prkce.bbe) (A) after 1R, 2R and 3R (B) with chromosomal locations of the nPKCd genes and their neighboring gene families in human (C), chicken (D), spotted gar (E) and zebrafish (F). The tree topology is supported by a non-parametric Ultra-Fast Bootstrap (UFBoot) analysis. The full tree values in Newick format file can be downloaded as supplementary material. Crosses indicate gene loss or gene not yet identified. The number below each gene shows the position in the chromosome. The order of the genes along the chromosomes has been adjusted to highlight the similarities. Chicken and spotted gar illustrations are used with permission from Daniel Ocampo Daza, source: https://www.egosumdaniel.se and the human image is used with permission from https://commons.wikimedia.org. This paralogon is referred to as paralogon G in this study. |

Fig. 7. Phylogenetic maximum likelihood tree of the aPKC genes, rooted with the amphioxus aPKC gene (apkc.bbe) (A) after 1R, 2R and 3R (B) with chromosomal locations of the nPKCd genes and their neighboring gene families in human (C), chicken (D), spotted gar (E) and zebrafish (F). The tree topology is supported by a non-parametric Ultra-Fast Bootstrap (UFBoot) analysis. The full tree values in Newick format file can be downloaded as supplementary material. Crosses indicate gene loss or gene not yet identified. The number below each gene shows the position in the chromosome. The order of the genes along the chromosomes has been adjusted to highlight the similarities. Chicken and spotted gar illustrations are used with permission from Daniel Ocampo Daza, source: https://www.egosumdaniel.se and the human image is used with permission from https://commons.wikimedia.org. This paralogon is referred to as paralogon F in this study. |
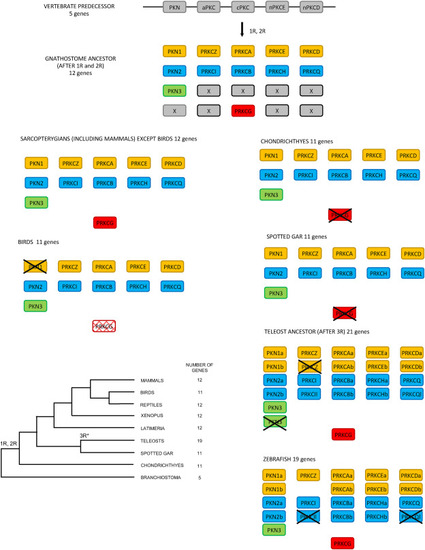
Fig. 8. Proposed evolution of the PKC family following the 1R and 2R tetraploidizations and after 3R in teleosts. The scheme shows how the fourth ohnolog of the PKN and cPKC subfamilies was lost after 2R. For the two subfamilies of nPKCs and the aPKCs, two scenarios are possible: either one ohnolog was lost after 1R or two ohnologs were lost after 2R. Of the 12 genes that existed before 3R, 7 have retained 3R ohnologs while 5 were lost leading to 19 genes. |
Reprinted from Developmental Biology, 479, Garcia-Concejo, A., Larhammar, D., Protein kinase C family evolution in jawed vertebrates, 77-90, Copyright (2021) with permission from Elsevier. Full text @ Dev. Biol.