
|
Fig. 3
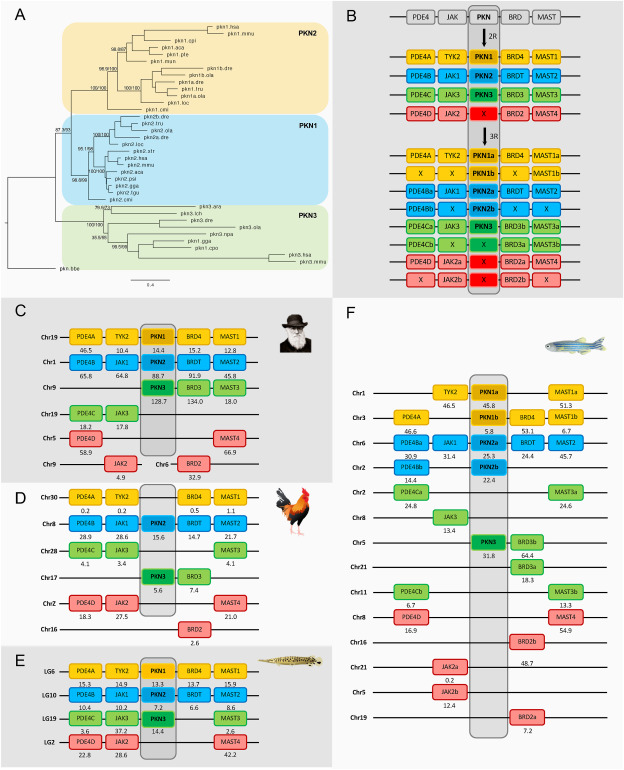
Fig. 3. Phylogenetic maximum likelihood tree of the PKN genes, rooted with the amphioxus PKN gene (A). Analysis of the evolution of the PKN family after 1R, 2R and 3R (B) with chromosomal locations of the PKN genes and their neighboring gene families in human (C), chicken (D), spotted gar (E) and zebrafish (F). Crosses indicate gene loss or gene not yet identified. The number below each gene shows the position in the chromosome. The order of the genes along the chromosomes has been adjusted to highlight the similarities. PKN1 was not found in any of the birds, but it is present in the reptiles. Two sequences annotated in ENSEMBL as PKN1 are in fact PKN3, namely chicken (marked as pkn1.gga) and Australian saltwater crocodile (pkn1.cpo) as shown in the tree. The tree topology is supported by a non-parametric Ultra-Fast Bootstrap (UFBoot) analysis. The full tree values in Newick format file can be downloaded as supplementary material. Each color field corresponds to one PKN ohnolog. Chicken and spotted gar illustrations are used with permission from Daniel Ocampo Daza, source: https://www.egosumdaniel.se and the human image is used with permission from https://commons.wikimedia.org. This paralogon is referred to as paralogon A in this study.
Reprinted from Developmental Biology, 479, Garcia-Concejo, A., Larhammar, D., Protein kinase C family evolution in jawed vertebrates, 77-90, Copyright (2021) with permission from Elsevier. Full text @ Dev. Biol.