
- Title
-
Fish primary embryonic pluripotent cells assemble into retinal tissue mirroring in vivo early eye development
- Authors
- Zilova, L., Weinhardt, V., Tavhelidse, T., Schlagheck, C., Thumberger, T., Wittbrodt, J.
- Source
- Full text @ Elife
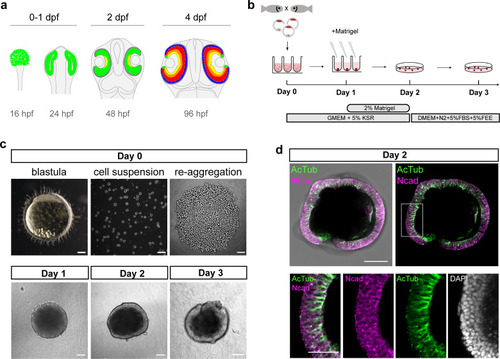
(a) Scheme representing stages and timing of the medaka fish retinal development. The retinal domain is indicated in green. Establishment of the eye field within the anterior neural plate is followed by the formation of optic vesicles at 1 day post-fertilization (dpf). Optic vesicle evagination is followed by the morphogenesis of a bi-layered optic cup formed by retina surrounded by retinal pigmented epithelium (RPE) and subsequent onset of retinal differentiation at 2 dpf. By 4 dpf, the major retinal cell types – retinal ganglion cells (yellow), amacrine cells (orange), bipolar cells (red), horizontal cells (cyan), and photoreceptor cells (blue) – are generated. (b) Schematic representation of aggregate generation, its timeline and culture conditions. At day 0, primary pluripotent cells were harvested from blastula-stage medaka embryos and re-aggregated in low binding U-shape 96-well plates. At day 1, the culture media was supplemented with Matrigel. At day 2, the aggregates were transferred to a low binding culture plate and maintained in 3D suspension culture conditions in DMEM/F12 media supplemented with 5% FBS, 5% FEE, and N2 supplement. The gross morphology of the aggregates was analyzed at days 1, 2, and 3. KSR, knockout serum replacement; FBS, fetal bovine serum; FEE, fish embryonic extract. (c) Dark-field images of a blastula-stage embryo, a blastula-derived cell suspension, and re-aggregated cells and the gross morphology of aggregates at days 1, 2, and 3 after re-aggregation. (d) Optical section showing aggregate organization at day 2 visualized by immunostaining against neuroepithelium-specific markers, N-cadherin (Ncad), and acetylated tubulin (AcTub), co-stained with DAPI nuclear stain. Scale bars: 100 and 50 μm (enlargement in (d)). |

Bright-field images of day 1 aggregates derived from early morula (64–128 cells), late morula (256–512 cells), and early blastula (1000 cells). Scale bar: 100 μm. |

Virtual planes of four day 2 aggregates, stained with N-cadherin (Ncad) and DRAQ5 nuclear stain, showing the interior cellular composition using SPIM imaging. Scale bar: 100 μm. |

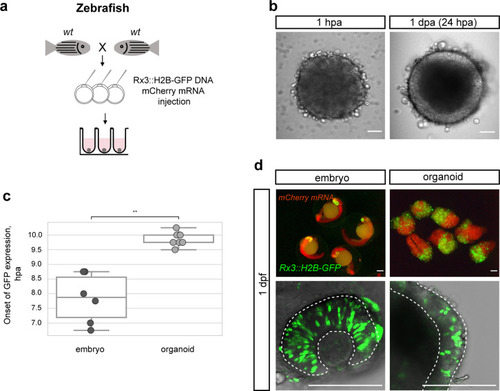
(a) Schematic representation of the Rx3::H2B-GFP transgenic construct and the corresponding expression domain of GFP in the optic vesicles of a developing medaka embryo at 1 dpf. (b) Scheme of organoid generation from Rx3::H2B-GFP transgenic fish. (c) Bright-field and fluorescence images of aggregates derived from Rx3::H2B-GFP transgenic fish at 0.5, 6, and 16 hpa. (d) Analysis of the onset of GFP expression in Rx3::H2B-GFP-derived fish embryos (n = 6) and organoids (n = 17). ***p<0.001. (e) Optical sections of day 1 (before the addition of Matrigel) and day 2 organoids derived from Rx3::H2B-GFP transgenic fish stained with antibodies against N-cadherin (Ncad) and GFP, co-stained with DAPI nuclear stain. (f) Generation of Rx3KO (Rx3saGFP) line – schematic representation of the Rx3 locus with integrated saGFP-OPT cassette. An open reading frame-adjusted gene trap cassette comprising a splice acceptor and a GFP sequence (saGFP) followed by a polyA and a strong terminator sequence derived from the ocean pout (OPT; STOP) were inserted into the Rx3 locus. (g) Scheme of organoid generation from Rx3-deficient single blastulae. (h) Bright-field and fluorescence images of phenotypes of Rx3saGFP/+(Rx3 +/- heterozygote) and Rx3saGFP/saGFP (Rx3 -/- homozygote) mutants at 1 dpf and corresponding organoids at day 2. dpf, days post-fertilization; hpa, hours post-aggregation; hpf, hours post-fertilization; wt, wild type. Scale bar: 100 μm. |

( |

Bright-field and fluorescence images of day 2 organoids derived from |

Optical sections of embryonic heads (upper panel) and organoids (lower panel) stained with antibodies showing expression of Rx2, Sox2, and Lhx2 co-stained with DAPI nuclear stain. Dashed lines indicate optic vesicles in an embryo or neuroepithelium in an organoid. dpf, days post-fertilization. Scale bar: 100 μm. |

Bright-field images of fish embryos 4 dpf showing the phenotypical consequence of cassette integration in the |
( |
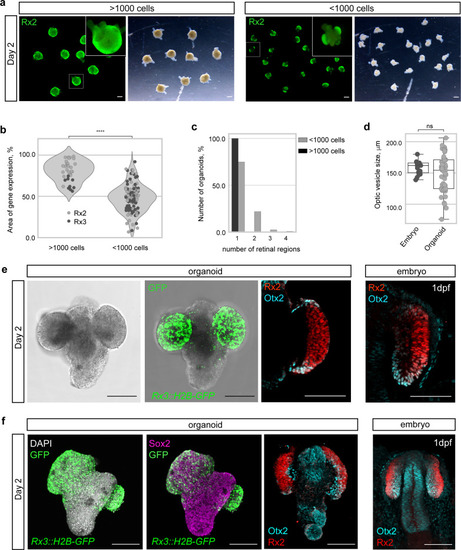
(a) Fluorescence and bright-field images of day 2 organoids produced by aggregation of >1000 cells and <1000 cells stained with anti-Rx2 antibody. (b) Analysis of the area of Rx2 (wild-type organoids stained with anti-Rx2 antibody) and Rx3 (Rx3::H2B-GFP-derived organoids stained with anti-GFP antibody) expression area (% of total organoid area) in day 2 organoids. ****p<0.0001. (c) Number of organoids forming (1–4) individual retinal regions produced by aggregation of >1000 (n = 26 for Rx2, n = 9 for Rx3) and <1000 (n = 57 for Rx2, n = 66 for Rx3) cells from nine independent experiments. (d) Size, measured as largest circumference, of the optic vesicle of 1 dpf embryos and optic vesicle-like structures formed by day 2 organoids (n = 16 embryos, n = 56 aggregates from six independent experiments). ns, non-significant. (e) Bright-field and fluorescent images of day 2 Rx3::H2B-GFP organoids stained with anti-GFP antibody. Optical sections of an organoid (day 2) (n = 9/10) and an embryo (1 dpf) stained with anti-Rx2 and anti-Otx2 antibodies. (f) Maximal projection of day 2 organoids and 1 dpf embryo generated from Rx3::H2B-GFP transgenic or wild-type blastulae and stained with neural tissue-specific anti-Sox2 (n = 12/12) and anti-Otx2 (n = 10/10) antibodies, co-stained with anti-Rx2 and DAPI nuclear stain. hpa, hours post-aggregation; dpf, days post-fertilization. Scale bars: 100 μm. |

Overlay of fluorescence and bright-field images of retinal organoids on day 2 generated from the |

Fluorescence images, bright-field images, and their overlay of retinal organoids on day 2 generated from the |

( |

(a) Scheme of organoid generation from Atoh7::EGFP transgenic fish. (b) Fluorescent images of day 3 Atoh7::EGFP organoids (generated by aggregation of <1000 cells). (c) Optical sections and maximal projections showing EGFP expression in the eye of the developing embryo at 2 dpf and the retinal organoid at day 3 co-stained with antibody against HuC/D and DAPI. (d) Optical sections showing expression of HuC/D (amacrine and ganglion cells), Otx2 (bipolar and photoreceptor cells), and Prox1 (horizontal cells) in day 4 organoid. (e) Sketch of the arrangement of cellular layers in the organoid and the embryonic retina. dpf, days post-fertilization. Scale bar: 100 μm. |

( |

( |