IMAGE

Figure 5.

ID
ZDB-IMAGE-210716-71
Source
Figures for Zilova et al., 2021
Image
Figure Caption

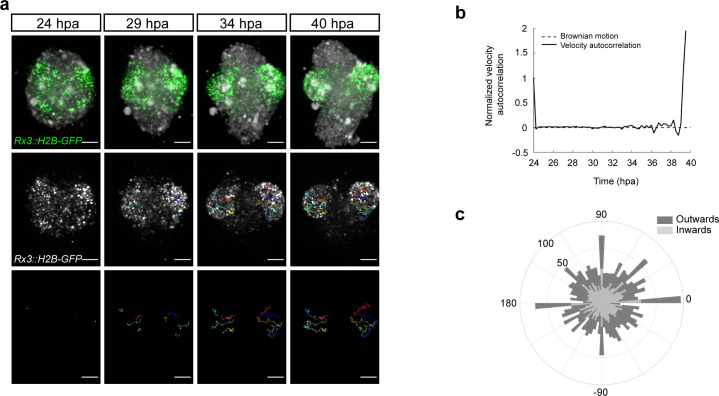
Figure 5. Dynamics of the optic vesicle formation in medaka organoids.

(a) In vivo time-lapse images acquired with MuVi SPIM of optic vesicle-like structure evagination in Rx3::H2B-GFP retinal organoids. From top to bottom: maximal projection of quasi bright field, GFP, and tracks of exemplary cells. (b) Normalized velocity autocorrelation for all tracks (n = 4600; from two optic vesicles of one organoid). (c) Directional histogram of tracks (n = 4600; from two optic vesicles of one organoid) separated for inward and outward movements. hpa, hours post-aggregation; dpf, days post-fertilization. Scale bar: 100 μm.

Acknowledgments
This image is the copyrighted work of the attributed author or publisher, and ZFIN has permission only to display this image to its users. Additional permissions should be obtained from the applicable author or publisher of the image. Full text @ Elife