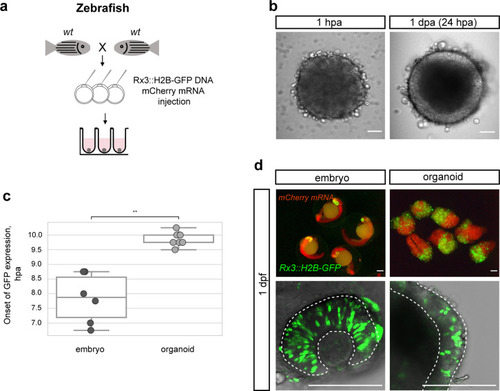
Figure 3.
- ID
- ZDB-FIG-210716-65
- Publication
- Zilova et al., 2021 - Fish primary embryonic pluripotent cells assemble into retinal tissue mirroring in vivo early eye development
- Other Figures
-
- Figure 1
- Figure 1—figure supplement 1.
- Figure 1—figure supplement 2.
- Figure 2
- Figure 2—figure supplement 1.
- Figure 2—figure supplement 2.
- Figure 2—figure supplement 3.
- Figure 2—figure supplement 4.
- Figure 3.
- Figure 4
- Figure 4—figure supplement 1.
- Figure 4—figure supplement 2.
- Figure 5.
- Figure 6
- Figure 6—figure supplement 1.
- Figure 6—figure supplement 2.
- All Figure Page
- Back to All Figure Page
|
( |

