
- Title
-
Protocol for analysis of integrin-mediated cell adhesion of lateral plate mesoderm cells isolated from zebrafish embryos
- Authors
- Rho, S.S., Oguri-Nakamura, E., Ando, K., Yamamoto, K., Takagi, Y., Fukuhara, S.
- Source
- Full text @ STAR Protoc
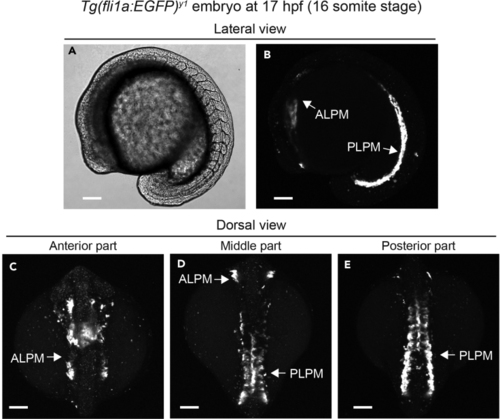
Visualization of LPM cells in the (A and B) DIC (A) and confocal stack fluorescence (B) images showing lateral view of the (C–E) Confocal stack fluorescence images showing dorsal view of the ALPM, anterior lateral plate mesoderm; PLPM, posterior lateral plate mesoderm. Scale bars, 100 μm. |
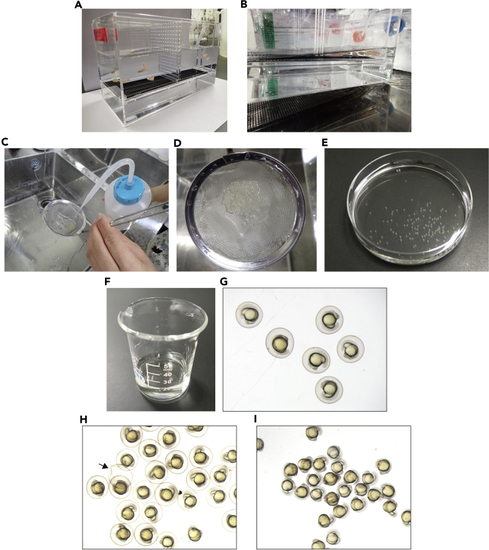
Preparation of the dechorionated zebrafish embryos at 17 hpf (A) Set up zebrafish to breed in the separate breeding tank (step 1). (B) Initiate breeding by removing the divider separating the male and female fish (step 2). (C) Rinse the embryos on the strainer with 0.03% sea salt solution (step 5). (D) Cleaned embryos on the strainer. (E) The embryos transferred into a 10-cm petri dish containing E3 medium (step 6). (F and G) The 17 hpf embryos transferred into a beaker containing E3 medium (step 8b). (H) The embryos treated with the Pronase solution (step 8d). Note that the chorions start to break open (arrow). (I) Dechorionated embryos in a 10-cm petri dish containing E3 medium (step 8g). |
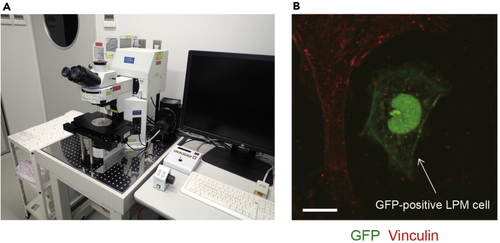
LPM cells adhering to the fibronectin-coated dish (A) FluoView FV1000 confocal upright microscope system. (B) The cells derived from 17 hpf embryos were left to adhere to the fibronectin-coated dish for 13 h and then stained with anti-GFP (green) and anti-vinculin (red) antibodies. Arrow indicates GFP-positive LPM cell. Scale bar, 10 μm. |
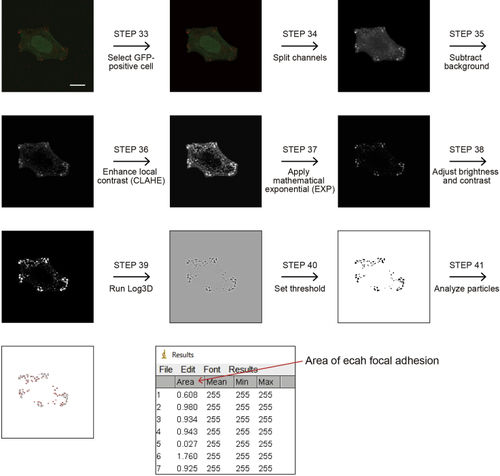
Sequence of image processing by ImageJ for analyzing the number and size of focal adhesions Scale bar, 10 μm. |
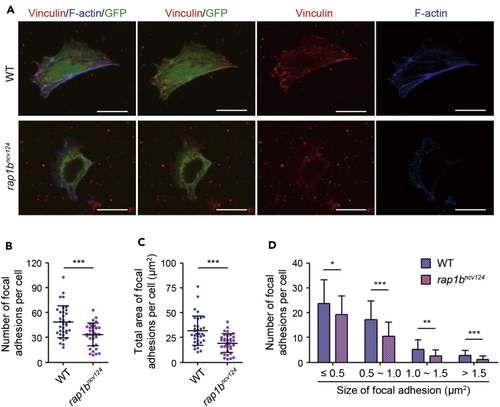
Rap1b regulates integrin-mediated adhesion of LPM cells to fibronectin-coated dishes (A) Cells dissociated from 17 hpf wild type (upper) and (B) Number of vinculin-marked focal adhesions per cell, as observed in (A). (C) Total area of vinculin-marked focal adhesions per cell, as observed in (A). (D) Number of vinculin-marked focal adhesions, as observed in (A). Data are shown as means ± s.d. ∗p < 0.05; ∗∗p < 0.01; ∗∗∗p < 0.001. (B)-(D) reuse parts of a figure from Rho et al. ( |