
Image
|
Figure Caption
Figure 1
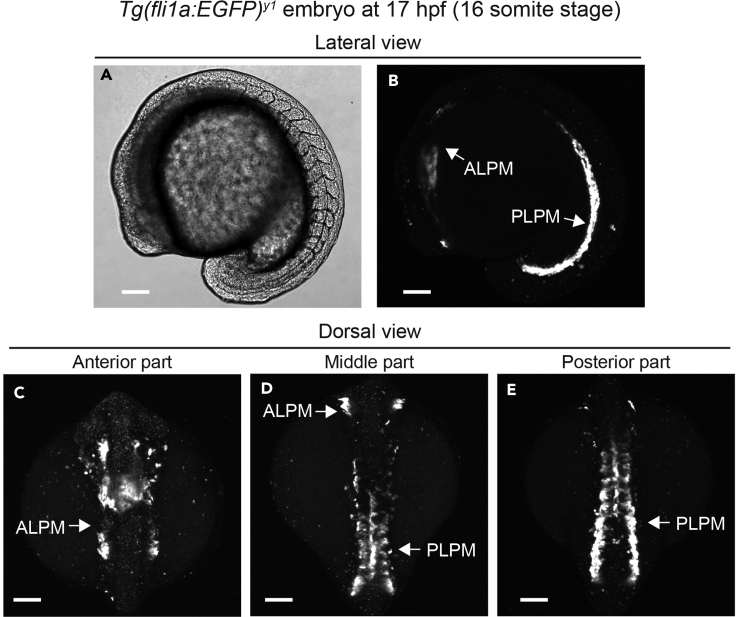
Visualization of LPM cells in the
(A and B) DIC (A) and confocal stack fluorescence (B) images showing lateral view of the
(C–E) Confocal stack fluorescence images showing dorsal view of the
ALPM, anterior lateral plate mesoderm; PLPM, posterior lateral plate mesoderm. Scale bars, 100 μm.
Acknowledgments
This image is the copyrighted work of the attributed author or publisher, and
ZFIN has permission only to display this image to its users.
Additional permissions should be obtained from the applicable author or publisher of the image.
Full text @ STAR Protoc