FIGURE SUMMARY
Title

Systematic identification of A-to-I RNA editing in zebrafish development and adult organs

Authors
Buchumenski, I., Holler, K., Appelbaum, L., Eisenberg, E., Junker, J.P., Levanon, E.Y.
Source
Full text @ Nucleic Acids Res.

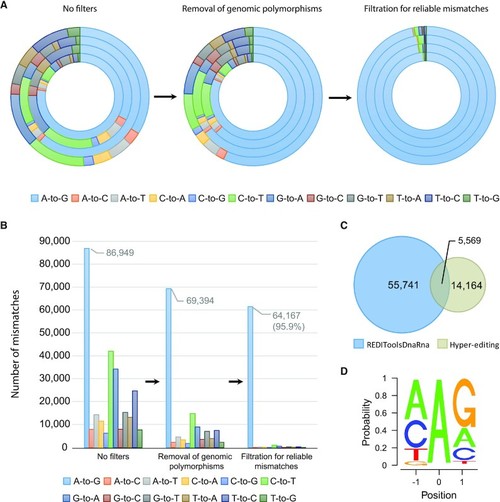
Schematic representation of the process for identifying RNA editing sites in zebrafish. (A) The procedure to detect novel A-to-I editing events in zebrafish (identified as A-to-G mismatches between DNA and RNA). Each round of the circle represents a sample, where the total number of any mismatches is represented by the relative proportion. Without applying any filters (left panel) there is a weak enrichment of A-to-G mismatches (32%-81% A-to-G out of all mismatches). Removing potential single nucleotide polymorphisms (SNPs) from the DNA sequencing data (middle panel) reduces the noise level (57–81% A-to-G out of all mismatches). Applying further cutoffs for mismatch enrichment and consistency (right panel) leaves predominantly A-to-G events (91.5–97% A-to-G out of all mismatches). (B) Tens of thousands of unique A-to-I editing sites were discovered. In each one of the filtering steps, the total number of mismatches of any type, summed over all four samples, is presented by absolute numbers. (C) A-to-I editing sites found in zebrafish by two detection methods: REDITools (45) and Hyper-editing (48). Overall, 76076 unique editing events were identified (overlap of only 5574 sites between the methods). (D) A-to-I editing sites exhibited the recognized ADAR motif with guanosine (G) depleted one base upstream and enriched one base downstream, as expected in ADAR targets.

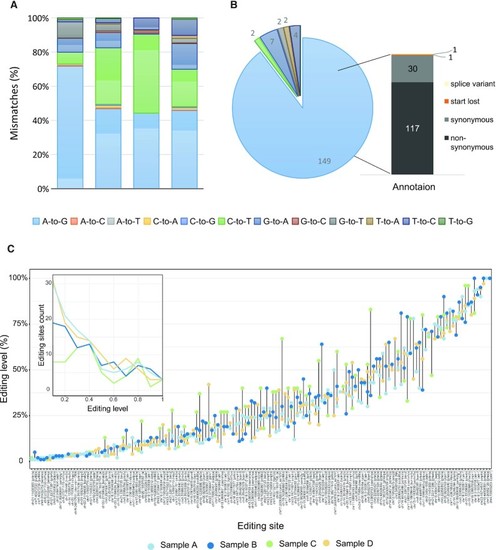
A-to-I editing sites within coding sequences. (A) Previously described pipeline after applying our filtering scheme for coding regions (Ensembl (88) annotations). The analyses were performed on the four brain samples. Low specificity of A-to-G mismatches was observed, suggesting a high false-positive rate. (B) Relative proportions of the total number of mismatches detected after considering only recoding sites appearing at least in two out of four samples. Most of the detected mismatches were of the A-to-G type. (C) Editing levels in 149 A-to-I editing events in CDS, colored by the sample in which it was detected.

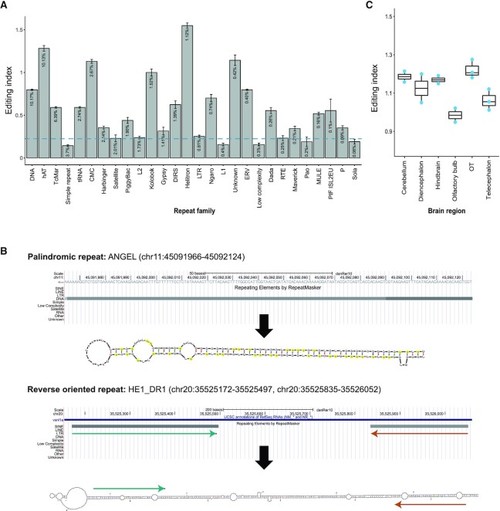
Editing in zebrafish repeats. (A) RNA editing index (defined as the editing level averaged over all edited and unedited adenosines) measured across all repeat families. The editing index varies across repeat families and is not enriched in a specific repeat family. The repeats ordered by their abundance in the genome (abundance percentage is shown within each bar). The blue line represents the maximal index of the next most frequent substitution (C-to-T mismatch in low complexity repeat family, value of 0.32%). (B) Prediction of the secondary structure of the most edited repeats. Upper structure represents the palindromic repeat, ANGEL, a member of hAT repeat family (using mfold (89)). Here, we show the most prominent single ANGEL repeat, with 62 unique editing sites (62/63 adenosines). Edited adenosines are marked in yellow; The lower structure represents a prediction of the secondary structure (using mfold (89)) of two reverse oriented HE1_DR1 repeats, members of SINE elements (tRNA-V family). (C) Global repeats editing index measured across six different brain regions.

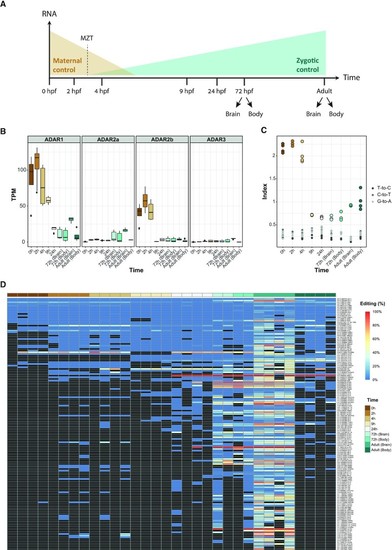
RNA editing during zebrafish development. (A) Graphical representation of zebrafish developmental stages. The sequenced samples are presented across a developmental time course. The early stages of the zebrafish development are driven by maternally supplied mRNA, followed by a slow activation of the zygotic genome, with a short period of maternal to zygotic transition (MZT). Brain adult samples are the same we used to detect the recoding sites. (B) ADAR expression levels suggest that ADAR1 and ADAR2b are overexpressed in the initial steps of embryonic development. (C) The repeats editing index was used to assess the editing activity across developmental stages. The editing index shows a similar pattern, with high levels of editing in early developmental stages, suggesting that ADAR1 and ADAR2b is are responsible for the alteration in editing levels. (D) Heat map of RNA editing frequency of 149 A-to-I sites obtained from the recoding detection. Only sites covered with more than 10 reads in at least one sample are shown. The color of each rectangle represents the editing level (white denotes 0% editing; blue denotes 100% editing). Black rectangles denote editing sites supported by <10 reads or those that had no coverage. The highest editing levels were found in samples from 72 h embryos and adult brain. Most of the sites in the early developmental stages had no coverage at all.

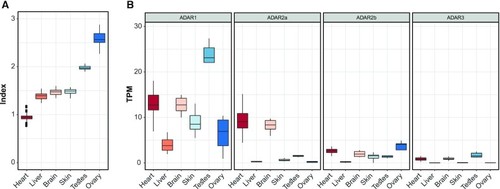
RNA editing across zebrafish tissues. (A) Global repeats editing index, the weighted editing level over all adenosines in the most edited repeats, as measured in six different tissues. The editing levels vary between the different tissues and were significantly elevated in testes and ovary. (B) Expression levels of ADAR enzymes in each tissue.

Acknowledgments
This image is the copyrighted work of the attributed author or publisher, and ZFIN has permission only to display this image to its users. Additional permissions should be obtained from the applicable author or publisher of the image. Full text @ Nucleic Acids Res.