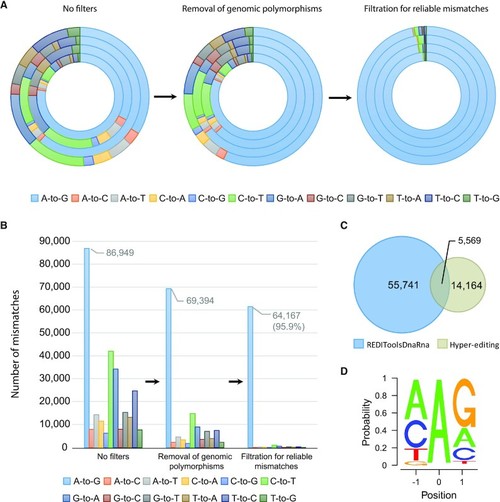
Schematic representation of the process for identifying RNA editing sites in zebrafish. (A) The procedure to detect novel A-to-I editing events in zebrafish (identified as A-to-G mismatches between DNA and RNA). Each round of the circle represents a sample, where the total number of any mismatches is represented by the relative proportion. Without applying any filters (left panel) there is a weak enrichment of A-to-G mismatches (32%-81% A-to-G out of all mismatches). Removing potential single nucleotide polymorphisms (SNPs) from the DNA sequencing data (middle panel) reduces the noise level (57–81% A-to-G out of all mismatches). Applying further cutoffs for mismatch enrichment and consistency (right panel) leaves predominantly A-to-G events (91.5–97% A-to-G out of all mismatches). (B) Tens of thousands of unique A-to-I editing sites were discovered. In each one of the filtering steps, the total number of mismatches of any type, summed over all four samples, is presented by absolute numbers. (C) A-to-I editing sites found in zebrafish by two detection methods: REDITools (45) and Hyper-editing (48). Overall, 76076 unique editing events were identified (overlap of only 5574 sites between the methods). (D) A-to-I editing sites exhibited the recognized ADAR motif with guanosine (G) depleted one base upstream and enriched one base downstream, as expected in ADAR targets.
|
