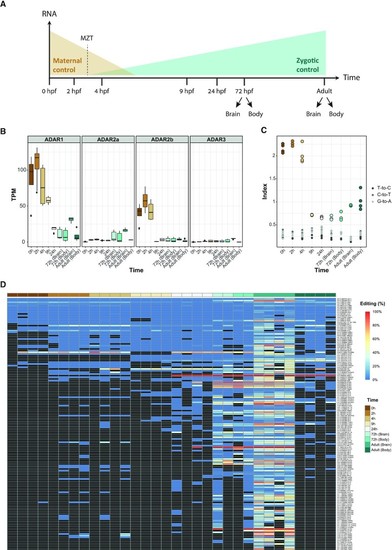
RNA editing during zebrafish development. (A) Graphical representation of zebrafish developmental stages. The sequenced samples are presented across a developmental time course. The early stages of the zebrafish development are driven by maternally supplied mRNA, followed by a slow activation of the zygotic genome, with a short period of maternal to zygotic transition (MZT). Brain adult samples are the same we used to detect the recoding sites. (B) ADAR expression levels suggest that ADAR1 and ADAR2b are overexpressed in the initial steps of embryonic development. (C) The repeats editing index was used to assess the editing activity across developmental stages. The editing index shows a similar pattern, with high levels of editing in early developmental stages, suggesting that ADAR1 and ADAR2b is are responsible for the alteration in editing levels. (D) Heat map of RNA editing frequency of 149 A-to-I sites obtained from the recoding detection. Only sites covered with more than 10 reads in at least one sample are shown. The color of each rectangle represents the editing level (white denotes 0% editing; blue denotes 100% editing). Black rectangles denote editing sites supported by <10 reads or those that had no coverage. The highest editing levels were found in samples from 72 h embryos and adult brain. Most of the sites in the early developmental stages had no coverage at all.
|
