IMAGE

Figure 1.

ID
ZDB-IMAGE-210512-42
Source
Figures for Buchumenski et al., 2021
Image
Figure Caption

Figure 1.

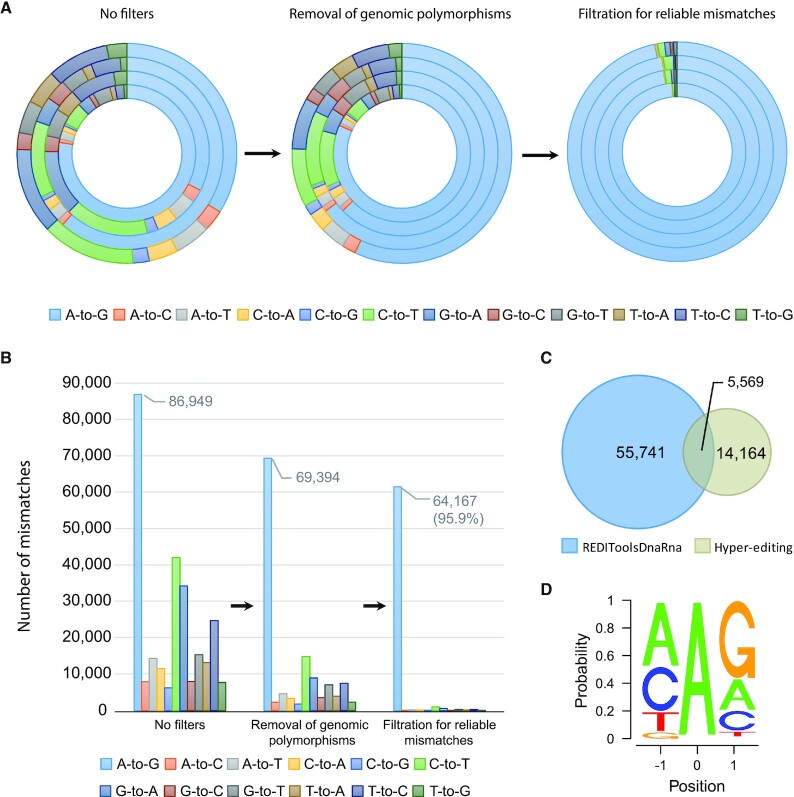
Schematic representation of the process for identifying RNA editing sites in zebrafish. (A) The procedure to detect novel A-to-I editing events in zebrafish (identified as A-to-G mismatches between DNA and RNA). Each round of the circle represents a sample, where the total number of any mismatches is represented by the relative proportion. Without applying any filters (left panel) there is a weak enrichment of A-to-G mismatches (32%-81% A-to-G out of all mismatches). Removing potential single nucleotide polymorphisms (SNPs) from the DNA sequencing data (middle panel) reduces the noise level (57–81% A-to-G out of all mismatches). Applying further cutoffs for mismatch enrichment and consistency (right panel) leaves predominantly A-to-G events (91.5–97% A-to-G out of all mismatches). (B) Tens of thousands of unique A-to-I editing sites were discovered. In each one of the filtering steps, the total number of mismatches of any type, summed over all four samples, is presented by absolute numbers. (C) A-to-I editing sites found in zebrafish by two detection methods: REDITools (45) and Hyper-editing (48). Overall, 76076 unique editing events were identified (overlap of only 5574 sites between the methods). (D) A-to-I editing sites exhibited the recognized ADAR motif with guanosine (G) depleted one base upstream and enriched one base downstream, as expected in ADAR targets.

Acknowledgments
This image is the copyrighted work of the attributed author or publisher, and ZFIN has permission only to display this image to its users. Additional permissions should be obtained from the applicable author or publisher of the image. Full text @ Nucleic Acids Res.