
- Title
-
A novel approach to measure mitochondrial respiration in frozen biological samples
- Authors
- Acin-Perez, R., Benador, I.Y., Petcherski, A., Veliova, M., Benavides, G.A., Lagarrigue, S., Caudal, A., Vergnes, L., Murphy, A.N., Karamanlidis, G., Tian, R., Reue, K., Wanagat, J., Sacks, H., Amati, F., Darley-Usmar, V.M., Liesa, M., Divakaruni, A.S., Stiles, L., Shirihai, O.S.
- Source
- Full text @ EMBO J.

Representative pyruvate + malate seahorse profile using RIFS the respirometry protocol in mouse liver mitochondria isolated from fresh or frozen tissue. Pyruvate + malate (Pyr + Mal), antimycin A + rotenone (AA + ROT), TMPD + ascorbate (TMPD/Asc), and azide were injected sequentially Pyruvate + malate‐ and TMPD/ascorbate (Complex IV, CIV)‐dependent respiration in fresh and frozen liver mitochondria. Representative succinate + rotenone seahorse profile using the RIFS respirometry protocol in mouse liver mitochondria isolated from fresh or frozen tissue. Succinate + rotenone (Succ)‐ and CIV‐dependent respiration in fresh and frozen liver mitochondria. Representative NADH seahorse profile using RIFS respirometry protocol in liver mitochondria isolated from fresh or frozen tissue. NADH‐ and CIV‐dependent respiration in fresh and frozen liver mitochondria. |

Representative pyruvate + malate seahorse profile using the standard respirometry protocol in mouse liver homogenates obtained from fresh or frozen tissue. Pyruvate + malate using the standard respirometry protocol. Pyruvate + malate + ADP (PMA), oligomycin (oligo), FCCP, and antimycin A + rotenone (AA + ROT) MRR dependent by pyruvate + malate in fresh and frozen liver homogenates. Representative succinate + rotenone seahorse profile using the standard respirometry protocol in liver homogenates obtained from fresh or frozen tissue. MRR dependent by succinate + rotenone in fresh and frozen liver homogenate. Representative NADH seahorse profile using the standard respirometry protocol in liver homogenates obtained from fresh or frozen tissue. MRR dependent by NADH in fresh and frozen liver homogenate. |

Representative pyruvate + malate seahorse profile using RIFS respirometry protocol in liver homogenates obtained from fresh or frozen tissue (top panel) and quantification (bottom panel). Representative succinate + rotenone seahorse profile using RIFS respirometry protocol in liver homogenates obtained from fresh or frozen tissue (top panel) and quantification (bottom panel). Representative NADH seahorse profile using RIFS respirometry protocol in liver homogenates obtained from fresh or frozen tissue (top panel) and quantification (bottom panel). NADH‐dependent respiration in frozen liver mitochondria in the presence of phenformin and metformin and the indicated concentration. Complex I‐, II‐, and IV‐dependent respiration in liver homogenates from WT and Representative Western blot followed by quantification of Complex I (NDUFA9 and NDUFB8) levels in |
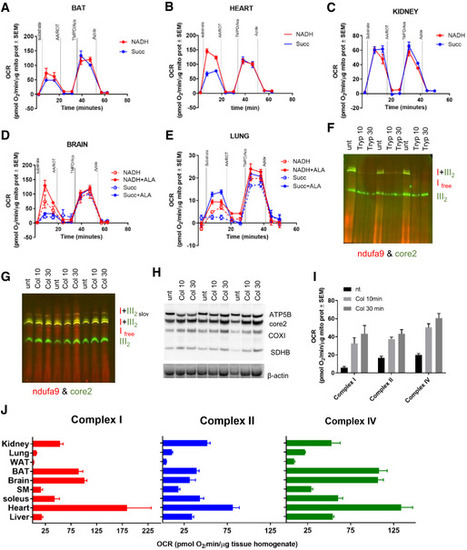
Representative seahorse profiles using RIFS respirometry protocol in frozen homogenates from mouse BAT (A), heart (B), kidney (C), brain (D), and lung (E). BNGE and Western blot of soleus muscle incubated with trypsin prior to homogenization. BNGE followed by Western blot of soleus muscle incubated with collagenase type II prior to homogenization. SDS–PAGE followed by Western blot of soleus muscle incubated with collagenase type II prior to homogenization. RIFS respirometry quantification in soleus muscle in the indicated conditions. Complex I‐, II‐, and IV‐dependent respiration in homogenates from frozen tissues from wild‐type mice using RIFS respirometry protocol per milligram of protein. |

Fluorescence in freshly isolated mouse liver mitochondria under the indicated treatments and stained with MTDR and MTR. Fluorescence was normalized by protein and referred as percentage of untreated samples. MTDR fluorescence in frozen liver mitochondria and homogenate at the indicated concentration. MTDR fluorescence correlates with protein amount but it saturates at higher protein levels. Linear correlation between MTDR fluorescence and protein abundance in frozen liver mitochondria and homogenate, when the system is not saturated. For this correlation, saturation values have been excluded and only linear range values have been considered. MTDR Operetta imaging in frozen liver mitochondria and homogenate at the indicated concentration. Western blot for mitochondrial protein and actin in increasing concentrations of frozen liver mitochondria and homogenate as indicated. Correlation between MTDR fluorescence (from B and C) and protein levels (from E) in frozen liver mitochondria and homogenate. MTDR Operetta imaging in frozen homogenates of different tissues. MTDR fluorescence in frozen tissue homogenate by microgram of sample. Spectrophotometric citrate synthase activity measure by milligram of lysate. Western blot and quantification of mitochondrial protein by actin (loading control) in tissue homogenates. |
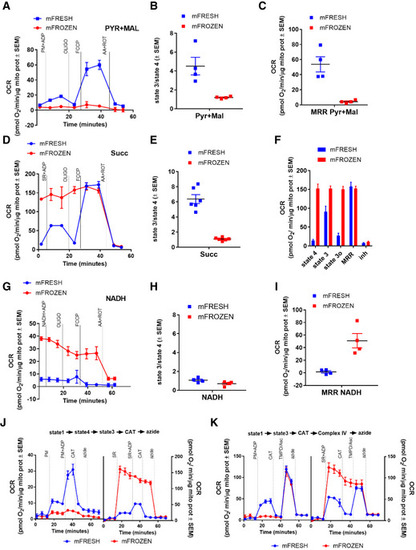
Representative traces of oxygen consumption rate (OCR) of mouse liver mitochondria isolated from fresh or frozen tissue sustained by pyruvate + malate. Pyruvate + malate + ADP (PM + ADP), oligomycin (oligo), FCCP, and antimycin A + rotenone (AA + ROT) were sequentially injected to assess mitochondrial respiratory states. Pyruvate + malate‐dependent state 3 (substrate plus ADP)/state 4 (substrate without ADP) in fresh and frozen liver mitochondria. Quantification of maximal respiration rate (MRR) supported by pyruvate + malate in fresh and frozen liver mitochondria. Representative traces of OCR of liver mitochondria isolated from fresh or frozen tissue supported by the Complex II substrate succinate + rotenone + ADP (SR + ADP). Succinate + rotenone‐dependent state 3/state 4 in fresh and frozen liver mitochondria. Quantification of the different bioenergetic parameters sustained by succinate + rotenone in fresh and frozen liver mitochondria. Representative traces of OCR of liver mitochondria isolated from fresh or frozen tissue sustained by the Complex 1 substrate NADH + ADP. NADH‐dependent state 3/state 4 in fresh and frozen liver mitochondria. MRR driven by NADH in fresh and frozen liver mitochondria. Representative traces of OCR of liver mitochondria isolated from fresh or frozen tissue starting in state 1 and sustained by substrates without ADP (state 4) and by substrates with ADP (state 3). Mitochondria were tested for CAT sensitivity. Representative traces of OCR of liver mitochondria isolated from fresh or frozen tissue starting in state 1 and sustained by substrates with ADP (state 3). Mitochondria were tested for CAT sensitivity. |
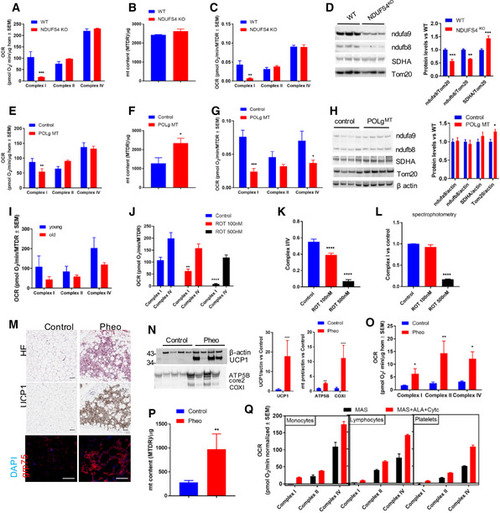
A–D. Complex I‐, II‐, and IV‐dependent respiration by protein (A), MTDR mitochondrial content (B), Complex I‐, II‐, and IV‐dependent respiration corrected by mitochondrial mass (C), and Western blot followed by quantification (D) in heart homogenates from WT and Ndufs4 KO mice. E. Complex I‐, II‐, and IV‐dependent respiration by protein in Polg mutant (Polg MT) and control heart homogenates. F. MTDR mitochondrial content in Polg MT and control heart homogenates. G. Complex I‐, II‐, and IV‐dependent respiration corrected by mitochondrial mass. H. Western blot followed by quantification in heart homogenates from WT (control) and Polg MT mice. I. Quantification of Complex I‐, II‐, and IV‐dependent respiration in zebrafish muscle homogenate from young and old fish. J. Quantification of Complex I‐ and IV‐dependent respiration using RIFS in zebrafish deyolked embryo homogenate acutely treated with rotenone before freezing. K. Complex I to Complex IV ratio in zebrafish deyolked embryo homogenate in the indicated conditions. L. Complex I activity measure spectrophotometrically in zebrafish deyolked embryo homogenate in the indicated conditions. M. Representative H&E sections from human donors show the presence of multilocular adipose tissue in the pheochromocytoma (Pheo) sample. UCP1‐DAB staining (central panels) and Grp75/mortalin fluorescence staining (bottom panels) from control and Pheo patients. N. Western blot followed by quantification in homogenates from control and Pheo patients. O. Complex I‐, II‐, and IV‐dependent respiration by protein in periadrenal adipose tissue homogenates from control and Pheo human patients. P. Mitochondrial content by MTDR quantification in homogenates from control and Pheo human patients. Q. Quantification of complex activities (I, II, and IV) in MAS versus MAS supplemented with Cyt c and ALA buffer in isolated and cryopreserved human monocytes, lymphocytes, and platelets. |