FIGURE SUMMARY
Title

Loss of splicing factor IK impairs normal skeletal muscle development

Authors
In Ka, H., Seo, H., Choi, Y., Kim, J., Cho, M., Choi, S.Y., Park, S., Han, S., An, J., Chung, H.S., Yang, Y., Kim, M.J.
Source
Full text @ BMC Biol.

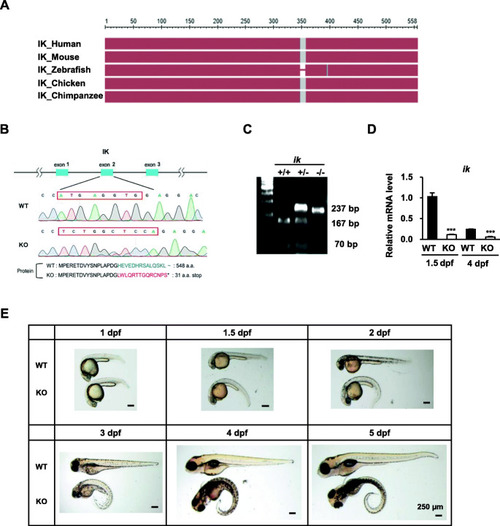
CRISPR/Cas9-mediated
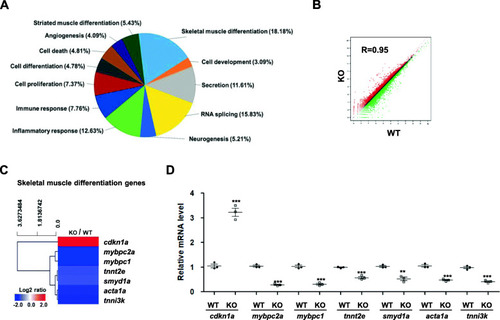
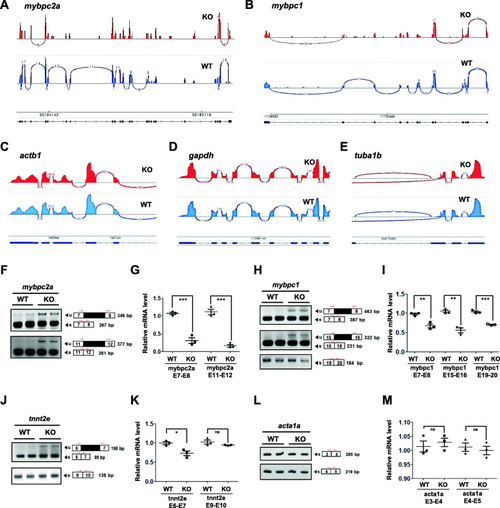
 ik knock-out (KO) embryos display abnormal embryonic phenotypes and lethality. a Sequence alignment of IK proteins from human, mouse, zebrafish, chicken, and chimpanzee by NCBI COBALT. The conserved sequence is shown in red. b Schematic of zebrafish ik locus and CRISPR/Cas9 targeted region. The asterisk denotes the stop codon. c Genotype confirmation of ik in wild type (WT), heterozygous, KO embryos by RT-PCR analysis. WT alleles were digested with the BslI enzyme. +/+: 70 + 167 bp, +/−: 70 + 167 + 237 bp, −/−: 237 bp. d Relative mRNA levels of ik in WT and ik KO embryos at 1.5 and 4 days post-fertilization (dpf) using qRT-PCR analysis. The average of three independent experiments is shown with error bars. e Lateral views of WT and ik KO embryos during embryonic development. Scale bar = 250 μm

EXPRESSION / LABELING:
Gene:
Fish:
Anatomical Term:
Stage Range: Prim-25 to Day 4

RNA-seq analysis of ik KO embryos reveals downregulation of genes involved in skeletal muscle differentiation. a Distribution of RNA-seq profiling annotated to the biological process categories in 3 dpf ik KO embryos relative to WT. b Linear filter model showing overall gene expression correlation between WT and ik KO embryos. The Spearman correlation coefficient (R = 0.95) is indicated. c Heat map and hierarchical clustering of 7 differentially expressed skeletal muscle differentiation-related genes whose log2 of mRNA ratio was at least 2-fold in ik KO embryos relative to WT. Upregulated signals relative to the mean are indicated in red. Downregulated signals are in green color (scale bar, log 2 of mRNA ratio). d Relative mRNA expression levels of mybpc2a, mybpc1, tnnt2e, smyd1a, acta1a, and tnni3k in 3 dpf embryos as measured by quantitative RT-PCR. The average of three independent experiments is shown with error bars; 18S rRNA was used as a normalization control. **p < 0.01, ***p < 0.001

ik KO embryos show damaged pre-mRNA splicing events in skeletal muscle differentiation genes. ae Sashimi plots for visualizing splicing events on the amybpc2a, bmybpc1, cactb1, dgapdh, and etuba1b genes from the Integrative Genomics Viewer (IGV) browser in WT (blue plots; lower) and ik KO embryos (red plots; upper). In Sashimi plots, the x-axis represents genomic location, and the y-axis represents the level of transcription. In each plot, the “sashimi-like” features mean transcribed exonic regions, and the blank regions between exonic regions are intronic regions. The junction reads crossing exons are indicated as the “bridges” and the numbers on the bridges mean junction read counts. In each plot, minimum splice junction coverage was set to 5 for visual clarity and statistical significance. fm The validation of pre-mRNA splicing events by qualitative and quantitative RT-PCR analysis for f, gmybpc2a, h, imybpc1, j, ktnnt2e, and l, macta1a in 4 dpf WT and ik KO embryos. The average of three independent experiments is shown with error bars; 18S rRNA was used as a normalization control for relative mRNA level analysis. ns no significant, *p < 0.05, **p < 0.01, ***p < 0.001

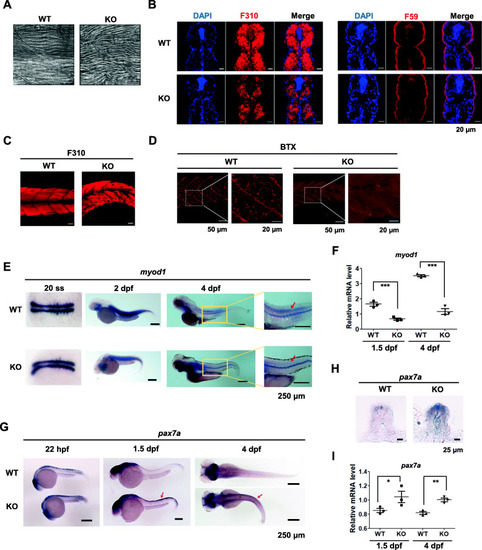
Fast-twitch muscle fibers are impaired in ik KO embryos with downregulated myod1. a DIC confocal images of the skeletal muscle at 3 dpf WT and ik KO embryos. Scale bar = 20 μm. b Transverse sections of the skeletal muscle stained with anti-F310 (fast-twitch muscle fibers; left panel) and anti-F59 (slow-twitch muscle fibers; right panel) in 4 dpf WT and ik KO embryos. Scale bar = 20 μm. c Whole-mount immunostaining with anti-F310 (fast-twitch muscle fibers) of 4 dpf WT and ik KO embryos. Scale bar = 20 μm. d Whole-mount immunostaining with α-bungarotoxin (BTX) in 4 dpf WT and ik KO embryos. e Whole-mount in situ hybridization for myod1 mRNA in 20 somite stage (ss), and 2 dpf and 4 dpf WT and ik KO embryos. The red arrow indicates the position of signal myod1. Scale bar = 250 μm. f Relative myod1 mRNA levels in WT and ik KO embryos at 1.5 dpf and 4 dpf. The average of three independent experiments is shown with error bars. ***p < 0.001. g Whole-mount in situ hybridization for pax7a mRNA in WT and ik KO embryos at 22 hpf, 1.5 dpf, and 4 dpf. The red arrow indicates the position of signal pax7a. Scale bar = 250 μm. h Transverse section of whole-mount in situ hybridization for pax7a in 1.5 dpf WT and ik KO embryos. Scale bar = 25 μm. i Relative pax7a mRNA levels of 1.5 and 4 dpf WT and ik KO embryos. The average of three independent experiments is shown with error bars. *p < 0.05, **p < 0.01

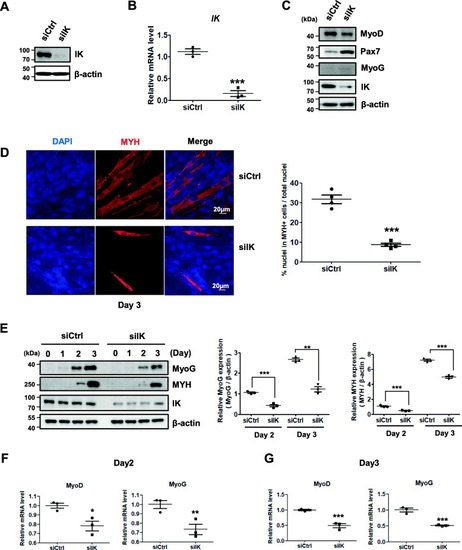
IK-depleted myoblasts have a reduced ability to form normal myotubes. a Immunoblot analysis of IK from C2C12 myoblasts transfected with siIK for 48 h. b Relative mRNA levels of IK from C2C12 myoblast transfected with siIK for 48 h using qRT-PCR analysis. 18S rRNA was used as a normalization control. ***p < 0.001. c Immunoblot analysis of Pax7, MyoD, and MyoG from C2C12 myoblasts transfected with siIK for 48 h. d Immunocytochemistry image stained with anti-MYH antibody from IK-depleted C2C12 cells at day 3 of differentiation. Scale bar = 20 μm (left panel). For fusion index for myotubes, the ratio of the number of nuclei in MYH-positive myotubes per the total nuclei in one field was quantified from four random microscopic fields; (right panel) ***p < 0.001. e Immunoblot analysis of MyoG and MYH from C2C12 cells transfected for 18 h and harvested at days 0, 1, 2, and 3 after differentiation (left panel). The band intensity normalized to β-actin was graphed by ImageJ software (right panel). **p < 0.01, ***p < 0.001. f, g Relative mRNA levels of MyoD and MyoG from C2C12 myoblast f at day 2 and g day 3 after differentiation using qRT-PCR analysis. 18S rRNA was used as a normalization control. *p < 0.05, **p < 0.01, ***p < 0.001

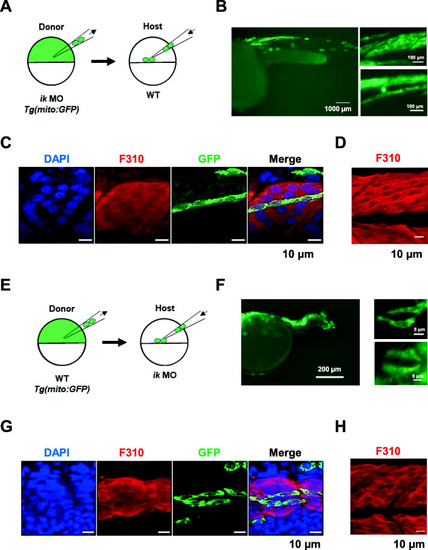
IK functions in a non-cell-autonomous manner in muscle precursors in zebrafish. a Schematic diagram of the cell transplantation. ik morpholino (MO) is injected into Tg (mito: GFP) donor embryo at the one-cell stage. At 4 hpf, the green fluorescent ik MO donor cells are transplanted into WT host embryo. b GFP expression in a chimeric WT host embryo at 36 hpf (left panel). High magnification image of the GFP-labeled cells located in the skeletal muscle (right panel). c Confocal images of chimeric WT host embryo at 36 hpf stained with anti-F310 antibody for fast-twitch muscle fibers and anti-GFP antibody for green fluorescent cells transplanted from ik MO donor embryos. d Confocal images of fast-twitch muscle fibers of WT embryos at 36 hpf stained with anti-F310 antibody. e Schematic diagram of cell transplantation. ik MO is injected into WT host embryo at the one-cell stage. At 4 hpf, the green fluorescent WT Tg (mito: GFP) donor cells are transplanted into ik MO host embryo. f GFP expression in a chimeric ik MO host embryo at 36 hpf (left panel). High magnification image of the GFP-labeled cells located in the skeletal muscle (right panel). g Confocal images of chimeric ik MO host embryo at 36 hpf stained with anti-F310 antibody for fast-twitch muscle fibers and anti-GFP antibody for green fluorescent cells transplanted from WT donor embryo. h Confocal images of fast-twitch muscle fibers of ik MO embryo at 36 hpf stained with anti-F310 antibody

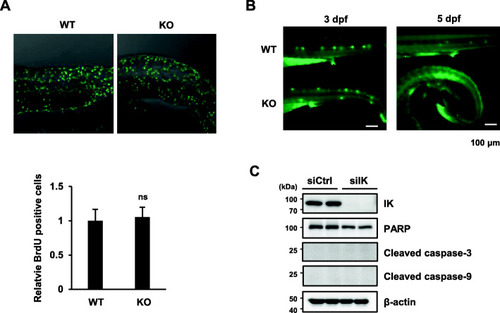
Myoblast proliferation and apoptosis was not affected in ik KO embryos. a Comparison of cell proliferation estimated through BrdU incorporation in 3 dpf WT and ik KO embryos. The relative number of BrdU-positive cells shown in the graph. ns not significant. b Analysis of apoptosis in 3 and 5 dpf WT and ik KO live embryos with acridine orange staining. c Immunoblot analysis of PARP, cleaved caspase-3, and cleaved caspase-9 in C2C12 myoblasts transfected with siIK#1 for 48 h

Acknowledgments
This image is the copyrighted work of the attributed author or publisher, and ZFIN has permission only to display this image to its users. Additional permissions should be obtained from the applicable author or publisher of the image. Full text @ BMC Biol.