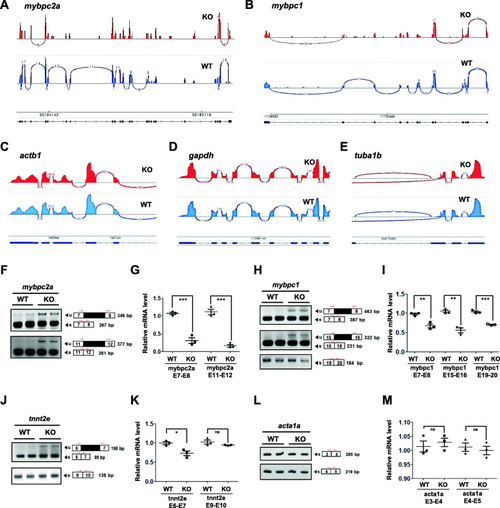
ik KO embryos show damaged pre-mRNA splicing events in skeletal muscle differentiation genes. a–e Sashimi plots for visualizing splicing events on the amybpc2a, bmybpc1, cactb1, dgapdh, and etuba1b genes from the Integrative Genomics Viewer (IGV) browser in WT (blue plots; lower) and ik KO embryos (red plots; upper). In Sashimi plots, the x-axis represents genomic location, and the y-axis represents the level of transcription. In each plot, the “sashimi-like” features mean transcribed exonic regions, and the blank regions between exonic regions are intronic regions. The junction reads crossing exons are indicated as the “bridges” and the numbers on the bridges mean junction read counts. In each plot, minimum splice junction coverage was set to 5 for visual clarity and statistical significance. f–m The validation of pre-mRNA splicing events by qualitative and quantitative RT-PCR analysis for f, gmybpc2a, h, imybpc1, j, ktnnt2e, and l, macta1a in 4 dpf WT and ik KO embryos. The average of three independent experiments is shown with error bars; 18S rRNA was used as a normalization control for relative mRNA level analysis. ns no significant, *p < 0.05, **p < 0.01, ***p < 0.001
|
