
- Title
-
NCK-associated protein 1 like (nckap1l) minor splice variant regulates intrahepatic biliary network morphogenesis
- Authors
- Ghaffari, K., Pierce, L.X., Roufaeil, M., Gibson, I., Tae, K., Sahoo, S., Cantrell, J.R., Andersson, O., Lau, J., Sakaguchi, T.F.
- Source
- Full text @ PLoS Genet.
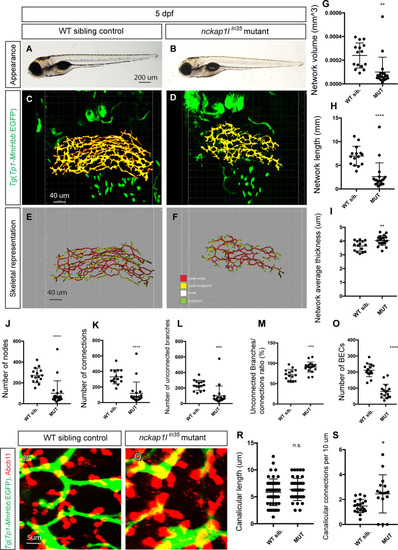
(A and B) Representative physical appearance of wild-type (WT) sibling (A) and |
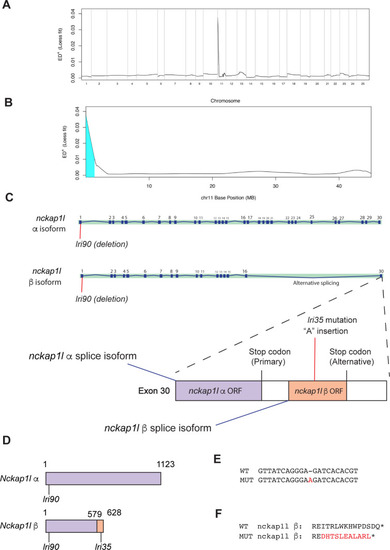
(A) Mapping of the |
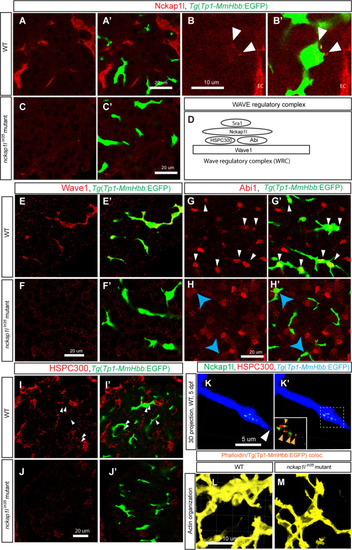
(A-C) Z-plane confocal images of the liver visualized for Nckap1l (Red) expression in wild-type (WT) (A and B) and |
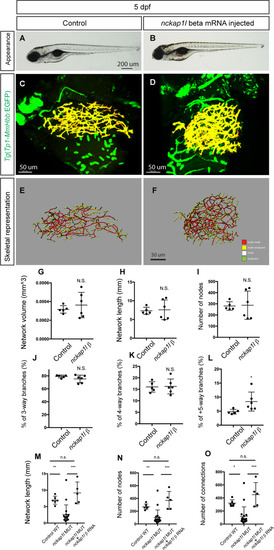
(A and B) Representative physical appearance of wild-type (WT) control (A) and |
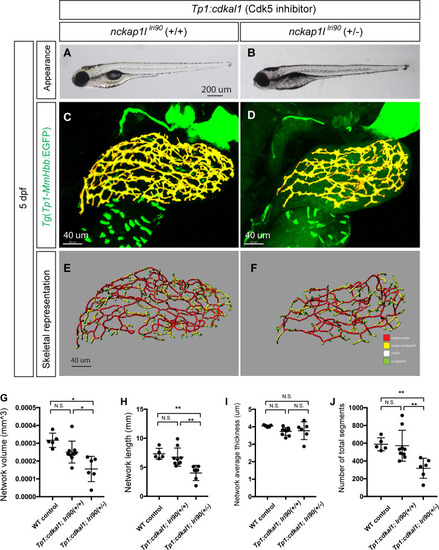
(A and B) Representative physical appearance of |
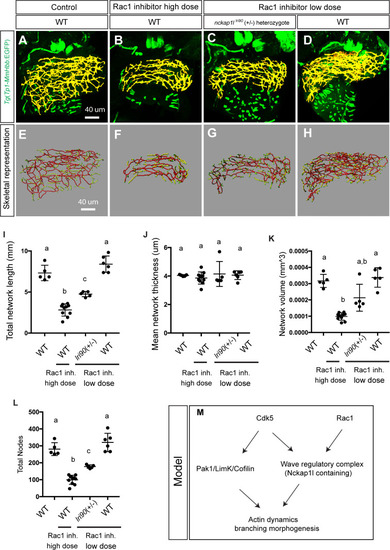
Wild-type and heterozygous PHENOTYPE:
|