IMAGE

Fig 3

ID
ZDB-IMAGE-210419-25
Antibodies
Source
Figures for Ghaffari et al., 2021
Image
Figure Caption

Fig 3 Expression of Nckap1l and other WRC proteins in the liver of wild-type and <italic>nckap1l</italic><sup><italic>lri35</italic></sup> mutant larvae.

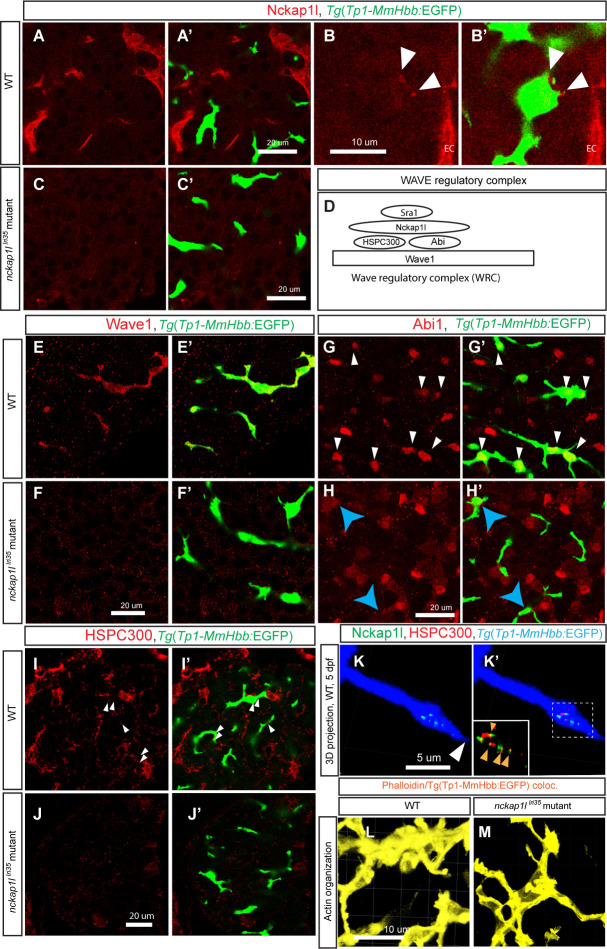
(A-C) Z-plane confocal images of the liver visualized for Nckap1l (Red) expression in wild-type (WT) (A and B) and nckap1llri35 mutant (C) larvae at 5 dpf. Overlay images with biliary epithelial cell marker Tg(Tp1-MmHbb:EGFP)um14 (Green) shown separately in (A’-C’). Nckap1l is predominantly expressed in endothelial cells in the liver (A), but higher magnification z-plane image (B) shows that Nckap1l is also localized in biliary epithelial cells (white arrowheads). Nckap1l expression is missing in the liver of nckap1llri35 mutant larvae (C). Ventral views, anterior to the top. EC, endothelial cells. (D-H) Components of the WAVE regulatory complex are degraded in biliary epithelial cells of nckap1llri35 mutant larvae. (D) Schematic drawing of the WAVE regulatory complex (WRC). This complex acts downstream of Cdk5 and activated Rac1 to stimulate actin remodeling through the actin regulatory complex. The WAVE regulatory complex is a pentameric heterocomplex that consists of WAVE (1, 2 or 3), Abi (1 or 2), Sra1, Nckap1l (or Nap1), and HSPC300. (E and F) Z-plane confocal images of the liver visualized for WAVE1 expression (Red) in WT (E) and nckap1llri35 mutant (F) larvae at 5 dpf. Overlay images with biliary epithelial cell marker Tg(Tp1-MmHbb:EGFP)um14 are shown separately in (E’ and F’). WAVE1 is expressed predominantly in biliary epithelial cells in WT larvae; however, in nckap1llri35 mutant larvae, WAVE1 expression disappears from biliary epithelial cells, suggesting that WAVE1 undergoes degradation in biliary epithelial cells. (G and H) Z-plane confocal images of the liver visualized for Abi1 expression in WT (G) and nckap1llri35 mutant (H) larvae at 5 dpf. Overlay images with biliary epithelial cell marker Tg(Tp1-MmHbb:EGFP)um14 are shown separately in (G’ and H’). Abi1 localizes to the nuclei of hepatocytes and biliary epithelial cells (white arrowheads) in the wild-type liver. However, in the liver of nckap1llri35 mutant larvae, Abi1 staining in the nuclei of biliary epithelial cells is lost (yellow arrows), while Abi1 expression remains in hepatocytes, suggesting that Abi1 undergoes degradation specifically in biliary epithelial cells. (I and J) Z-plane confocal images of the liver visualized for HSPC300 expression in WT (I) and nckap1llri35 mutant (J) larvae at 5 dpf. Overlay images with biliary epithelial cell marker Tg(Tp1-MmHbb:EGFP)um14 are shown separately in (I’ and J’). Similar to Nckap1l, HSPC300 is predominantly expressed in endothelial cells in the liver, but HSPC300 is also expressed in biliary epithelial cells (White arrowheads in I). HSPC300 expression is missing in the liver of nckap1llri35 mutant larvae (J). (K) Projected confocal image of co-localizing signal between Nckap1l and Tg(Tp1-MmHbb:EGFP)um14 showing Nckap1l expression (pseudocolored green) in biliary epithelial cells at 5 dpf. Tg(Tp1-MmHbb:EGFP)um14 expression is shown in pseudocolored blue. Nckap1l is localized near the projection tip (white arrowhead), but not exactly at the tip. Colocalizing signal between HSPC300 and Tg(Tp1-MmHbb:EGFP)um14 showing HSPC300 expression (red) in biliary epithelial cells is overlaid in (K’). This indicates that HSPC300 is expressed in biliary epithelial cells. Nckap1l and HSPC300 colocalize in biliary epithelial cells (orange arrowheads) near the projection tips of biliary epithelial cells, suggesting that the WRC forms at this site. Boxed area is magnified and shown separately in the left bottom corner. A representing image of total 21 projection tips from 5 different wild-type larvae examined is shown. Ventral views, anterior to the top. (L and M) Projected co-localizing signal images computed based on Tg(Tp1-MmHbb:EGFP)um14 and phalloidin expressions visualizing the actin network in biliary epithelial cells in wild-type (I) and nckap1llri35 mutant (J) larvae at 5 dpf. Confocal images are representative of at least three independent experiments.

Figure Data
Acknowledgments
This image is the copyrighted work of the attributed author or publisher, and ZFIN has permission only to display this image to its users. Additional permissions should be obtained from the applicable author or publisher of the image. Full text @ PLoS Genet.