|
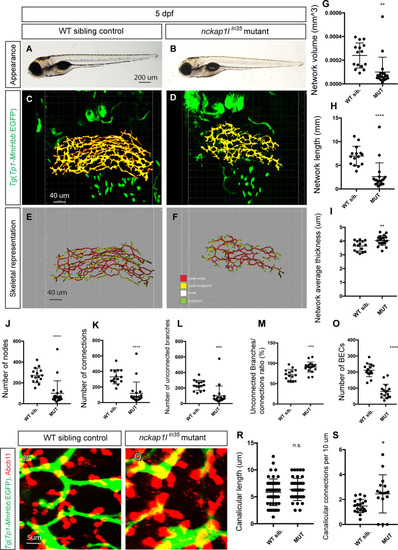
<italic>nckap1l</italic><sup><italic>lri35</italic></sup> mutant larvae show specific defects in the intrahepatic biliary network.(A and B) Representative physical appearance of wild-type (WT) sibling (A) and nckap1llri35 mutant (B) larvae at 5 days post-fertilization (dpf). Lateral views. At 5 dpf, there is no significant difference in physical appearance in nckap1llri35 mutant larvae, although their swim bladder inflation is occasionally delayed. (C and D) Projected confocal images of Tg(Tp1-MmHbb:EGFP)um14 expression in WT (C) and nckap1llri35 mutant (D) larvae at 5 dpf. GFP expression in the intrahepatic biliary network is shown in pseudocolored yellow. Ventral views, anterior to the top. (E and F) Skeletal representation of the intrahepatic biliary network in WT (E) and nckap1llri35 mutant (F) larvae computed based on Tg(Tp1-MmHbb:EGFP)um14 expression at 5 dpf. The complex three-dimensional network is represented by a combination of four segments: end points (colored green), nodes (colored white), node-node connections (colored red), and node-end point connections (colored yellow). (G-M) Computational skeletal analysis-based measurements of the intrahepatic biliary network structures of WT and nckap1llri35 mutant larvae at 5 dpf. (G) The total network volume of the intrahepatic biliary network marked by Tg(Tp1-MmHbb:EGFP)um14 expression in the liver. (H) The total network length of the intrahepatic biliary network. (I) The average thickness of the intrahepatic biliary network. (J) The total number of nodes existing in the intrahepatic biliary network. (K) The total number of node-to-node connections. (L) The total number of unconnected branches (node-to-end point connections). (M) The ratio of connected to unconnected branches shown as a percentage. Each dot represents the measurement data from one larva. n = 13 for WT siblings and n = 17 for mutant larvae. Error bars are standard deviation. *P<0.05, **P<0.01. n.s., not significant. (N and O) Projected images of confocal z-stacks of the liver in WT (N) or nckap1llri35 mutant (O) larvae visualized for expression of the bile canaliculi marker Abcb11 (Red) and the intrahepatic biliary network marker Tg(Tp1-MmHbb:EGFP)um14 (Green) at 5 dpf. (P) Average length of canaliculus measured based on Abcb11 expression. A total of 90 canaliculi were analyzed. (Q) The number of canaliculi connected per 10 μm of the intrahepatic biliary network (n = 50 for WT and n = 40 for nckap1llri35 mutant). Error bars are standard deviation. *P<0.05. n.s., not significant.
|