|
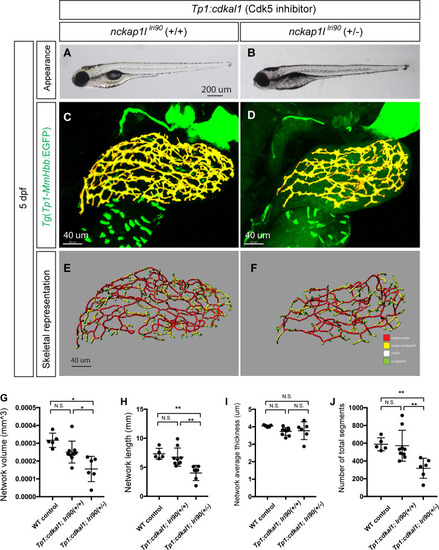
Dosage-sensitive genetic interaction between <italic>nckap1l</italic> and <italic>cdk5</italic> indicates these two genes function as part of the same pathway.(A and B) Representative physical appearance of Tg(tp1:cdkal1)kl109 larvae (nckap1llri90(+/+);Tg(tp1:cdkal1)kl109) (A), which expresses the Cdk5 inhibitor in biliary epithelial cells, and heterozygous nckap1llri90 larvae expressing Tg(tp1:cdkal1)kl109 (nckap1llri90(+/-);Tg(tp1:cdkal1)kl109) (B) at 5 dpf. At 5 dpf, there is no significant difference in physical appearance in both genotypes. (C and D) Projected confocal images of Tg(Tp1-MmHbb:EGFP)um14 expression in nckap1llri90(+/+);Tg(tp1:cdkal1)kl109 (C) and nckap1llri90(+/-);Tg(tp1:cdkal1)kl109 (D) larvae at 5 dpf. GFP expression in the intrahepatic biliary network is shown in pseudocolored yellow. nckap1llri90(+/-);Tg(tp1:cdkal1)kl109 larvae show more severe intrahepatic biliary network phenotypes than nckap1llri90(+/-);Tg(tp1:cdkal1)kl109 larvae, although heterozygous nckap1llri90 larvae show no observable phenotype without being crossed to Tg(tp1:cdkal1)kl109. (E and F) Skeletal representation of the intrahepatic biliary network in nckap1llri90(+/+);Tg(tp1:cdkal1)kl109 (E) and nckap1llri90(+/-);Tg(tp1:cdkal1)kl109 (F) larvae computed based on Tg(Tp1-MmHbb:EGFP)um14 expression at 5 dpf. The end points (green), nodes (white), node-node connections (red), and node-end point connections (yellow) are colored separately. Ventral views, anterior to the top. (G-J) Computational analysis-based measurements of the intrahepatic biliary network structures of wild-type (WT) control, nckap1llri90(+/+);Tg(tp1:cdkal1)kl109 and nckap1llri90(+/-);Tg(tp1:cdkal1)kl109 larvae at 5 dpf. n = 10 for nckap1llri90(+/+);Tg(tp1:cdkal1)kl109 and n = 7 for nckap1llri90(+/-);Tg(tp1:cdkal1)kl109. (G) The total network volume of the intrahepatic biliary network marked by Tg(Tp1-MmHbb:EGFP)um14 expression in the liver. (H) The total network length of the intrahepatic biliary network. (I) The average thickness of the intrahepatic biliary network. (J) Total segment number of the skeletonized network. These data together indicate that losing one copy of the nckap1l gene significantly enhanced the effect of Cdk5 suppression in biliary epithelial cells, suggesting that nckap1l and cdk5 function in the same signaling pathway. *P<0.05, and **P<0.01. n.s., not significant.
|