|
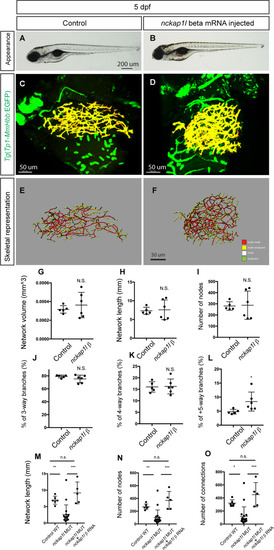
<italic>nckap1l</italic> ß overexpression induced biliary system-specific phenotypes.(A and B) Representative physical appearance of wild-type (WT) control (A) and nckap1l ß mRNA-injected (B) larvae at 5 dpf. Lateral views. At 5 dpf, there is no significant difference in physical appearance in larvae overexpressing nckap1l ß. (C and D) Projected confocal images of Tg(Tp1-MmHbb:EGFP)um14 expression in WT (C) and nckap1l ß RNA-injected (D) larvae at 5 dpf. GFP expression in the intrahepatic biliary network is shown in pseudocolored yellow. (E and F) Skeletal representation of the intrahepatic biliary network in WT (E) and nckap1l ß RNA-injected (F) larvae computed based on Tg(Tp1-MmHbb:EGFP)um14 expression at 5 dpf. The end points (green), nodes (white), node-node connections (red), and node-end point connections (yellow) are colored separately. Ventral views, anterior to the top. (G-L) Computational skeletal analysis-based measurements of the intrahepatic biliary network structures of WT and nckap1l ß RNA-injected larvae at 5 dpf. (G) The total network volume of the intrahepatic biliary network marked by Tg(Tp1-MmHbb:EGFP)um14 expression in the liver. (H) The total network length of the intrahepatic biliary network. (I) The number of nodes in the intrahepatic biliary network. (J) The ratio of 3-way branching nodes per all nodes shown as a percentage. (K) The ratio of 4-way branching nodes per all nodes shown as a percentage. (L) The ratio of 5-or-more-way branching nodes per all nodes shown as a percentage. These data together indicate that nckap1l ß RNA injection induced a phenotype in the intrahepatic biliary network. n = 5 for WT, and n = 6 for nckap1l ß RNA-injected larvae. (M-O) nckap1l ß RNA injection rescued nckap1llri35 mutant phenotypes. Network structural sub-parameters were calculated in uninjected nckap1llri35 mutant, uninjected wild-type, and nckap1l ß RNA-injected nckap1llri35 mutant larvae at 5 dpf. (M) The total network length. (N) The number of nodes. (O) The number of connections. *P<0.05, **P<0.01, and ***P<0.001. n.s., not significant.
|