
- Title
-
The role of Niemann-Pick type C2 in zebrafish embryonic development
- Authors
- Tseng, W.C., Johnson Escauriza, A.J., Tsai-Morris, C.H., Feldman, B., Dale, R.K., Wassif, C.A., Porter, F.D.
- Source
- Full text @ Development
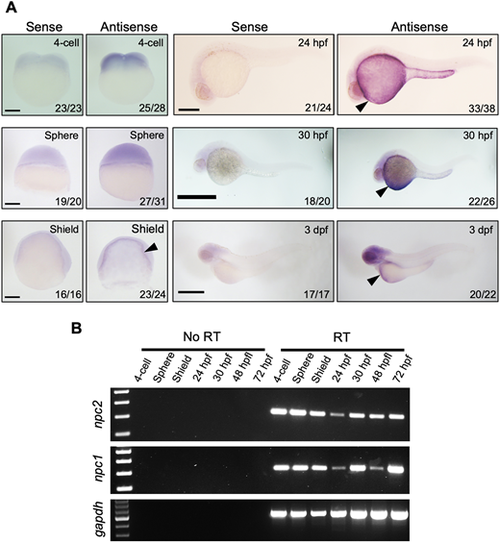
(A) mRNA expression of npc2 was characterized by in situ hybridization. Expression was ubiquitous at the 4-cell and sphere stage and became more intense in the yolk syncytial layer (arrowheads) to up to 3 dpf. Number of embryos showing representative staining over total embryos examined are indicated in each image. Scale bars: 200 μm (4-cell, Sphere and Shield); 500 μm (24 hpf, 30 hpf and 3 dpf). (B) RT-PCR assessment of npc2 and npc1 mRNA expression from the 4-cell stage to 72 hpf. gapdh was used as an internal control. EXPRESSION / LABELING:
|
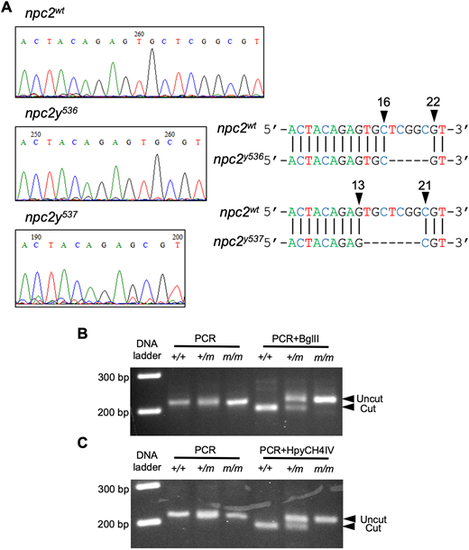
(A) Sequencing chromatographs of control npc2, npc2y536 and npc2y537 alleles. Arrowheads indicate the area of the induced deletion and nucleotide positions corresponding to the wild-type npc2 gene sequence. (B) Genotyping of npc2y536 was carried out by using a derived cleaved amplified polymorphic sequence (dCAPS) primer to introduce an artificial BglII restriction enzyme site in the PCR product amplified from the wild-type npc2 allele, followed by BglII digest. The PCR product from control but not npc2y536 was expected to be cut by BglII. (C) A dCAPS primer was used to introduce an artificial HpyCH4IV restriction enzyme site in the PCR product amplified from the control npc2 allele, followed by HpyCH4IV digest. The PCR product from control but not npc2y537 was expected to be cut by HpyCH4IV. |
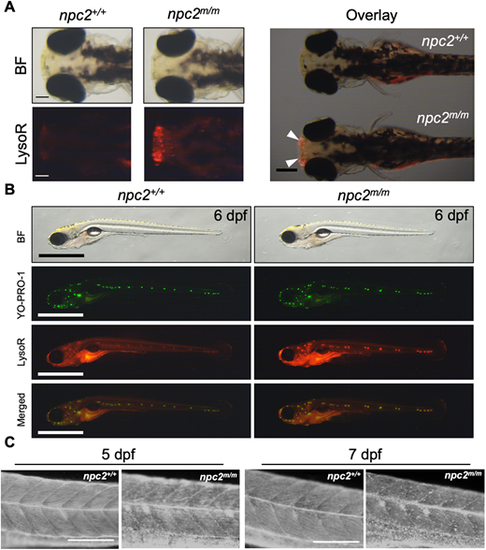
(A) Live 3 dpf npc2+/+ and npc2m/m larvae were stained with LysoTracker Red (LysoR) for 1 h and destained in egg water for 2 h before images were taken. npc2m/m larva showed intense LysoTracker Red staining of the olfactory placodes (arrowheads). A total of 47 npc2+/+ and 59 npc2m/m larvae were examined in three experiments. All examined larvae displayed the same staining patterns as shown here. Scale bars: 100 μm (individual); 400 μm (overlay). (B) Live double staining of npc2+/+ and npc2m/m larvae with YO-PRO-1 (neuromast cell marker) and LysoTracker Red. npc2m/m larva exhibited intense LysoTracker Red staining along lateral line neuromasts but the overall pattern of neuromast organization was unaffected. A total of 67 npc2+/+ and 75 npc2m/m larvae were examined from three experiments. All larvae displayed the same staining. Scale bars: 1 mm. (C) Filipin-positive puncta were present in 5 and 7 dpf npc2m/m larvae, indicating unesterified cholesterol accumulation. A total of 26 npc2+/+ and 19 npc2m/m 5 dpf larvae and 23 npc2+/+ and 28 npc2m/m 7 dpf larvae were examined in three experiments. All examined larvae displayed the same staining patterns. Scale bars: 200 μm. PHENOTYPE:
|
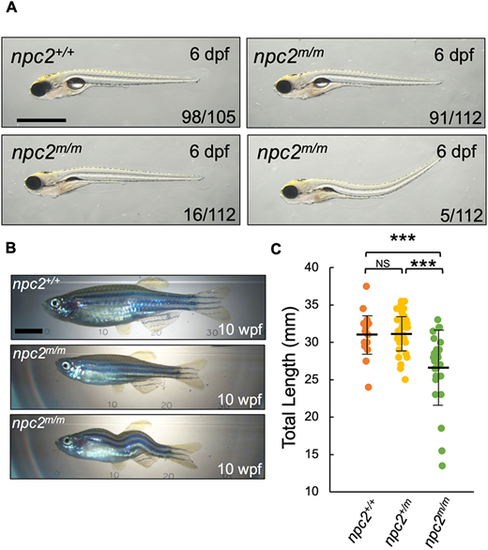
(A) npc2m/m larvae are mostly identical to npc2+/+ at 6 dpf; however, a few npc2m/m larvae lacked inflated swim bladders or had dorsally curved body axis. A total of 105 npc2+/+ and 112 npc2m/m from five crosses were examined. Numbers of larvae showing representing phenotypes are indicated in each image. Scale bar: 1 mm. (B) Live images of 10 wpf npc2m/m adults showed relatively normal morphology but smaller body size compared with npc2+/+ individuals. Occasionally, npc2m/m adults exhibited scoliosis. Scale bar: 5 mm. (C) Total length of npc2+/+ (31.16±3.01 mm), npc2+/m (31.34±2.68 mm) and npc2m/m (26.62±4.76 mm) adults at 10 wpf. A total of 16 npc2+/+, 32 npc2+/m and 26 npc2m/m adults were examined from two independent crosses. ***P<0.001 (one-way ANOVA and Tukey's test). Total length is presented as mean±s.d. NS, not significant. PHENOTYPE:
|
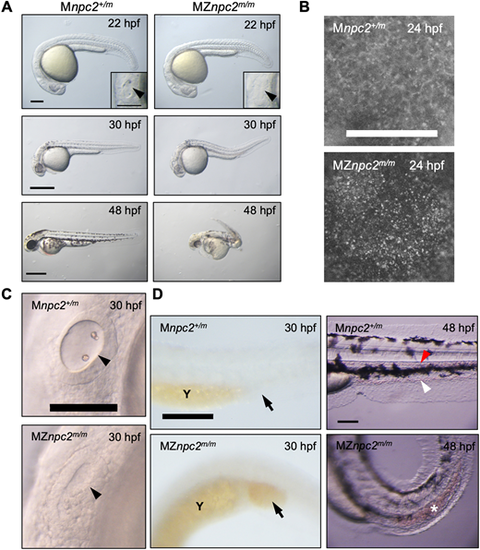
(A) Live imaging of MZnpc2m/m and Mnpc2+/m embryos. MZnpc2m/m embryos had essentially normal gross morphology except the lack of otoliths at 22 hpf. Otic vesicles are shown in the insets (arrowheads). Older MZnpc2m/m embryos manifested additional malformations, including abnormal head/brain development with reduced hindbrain, no circulating red blood cells, and a curved/twisted body axis at 30 and 48 hpf. All of the embryos from three separate crosses exhibited representing phenotypes as shown in each image (for 22 hpf: Mnpc2+/m n=22, MZnpc2m/m, n=18; for 30 hpf: Mnpc2+/m n=28, MZnpc2m/m n=33; for 48 hpf: Mnpc2+/m n=24, MZnpc2m/m n=21). Scale bars: 200 μm (22 hpf); 500 μm (30 and 48 hpf). (B) Filipin-positive puncta were found on the yolk surface of MZnpc2m/m embryos at 24 hpf. This signal appears to be from the yolk syncytial layer. Mnpc2+/m (n=25) and MZnpc2m/m (n=21) embryos were examined from three experiments. Scale bar: 200 μm. (C) Live imaging of otic vesicles at 30 hpf. Note that Mnpc2+/m embryos (n=28) exhibited two otoliths in the oval-shaped otic vesicle whereas MZnpc2m/m embryos (n=33) displayed a less-organized otic vesicle with no otoliths (arrowhead). Scale bar: 100 μm. (D) Red blood cells stained with O-dianisidine at 30 hpf. Red blood cells accumulated in the posterior blood island (arrow) in the MZnpc2m/m embryo (n=24), indicating that red blood cells were formed but not circulating in these embryos. This accumulation of RBCs was not observed in Mnpc2+/m embryos (n=21). At 48 hpf, circulating blood cells were observed in caudal artery (red arrowhead) and vein (white arrowhead) of the Mnpc2+/m embryos (n=18), whereas blood cells remained sequestered in the posterior blood island in MZnpc2m/m embryos (asterisk) (n=23). Y, yolk stalk extension. Scale bars: 200 μm (30 hpf); 100 μm (48 hpf). All experiments were repeated three times. PHENOTYPE:
|
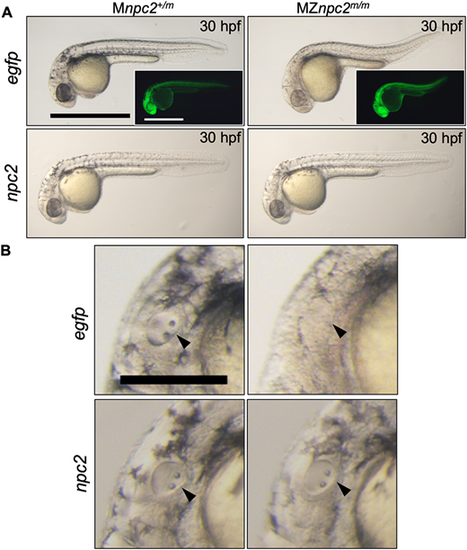
(A) Live imaging of 30 hpf Mnpc2+/m and MZnpc2m/m embryos injected with either 50 pg egfp (Mnpc2+/m n=27, MZnpc2m/m n=31) or npc2 mRNA (Mnpc2+/m n=32, MZnpc2m/m n=37) at the 1-cell stage (n=3 experiments). MZnpc2m/m embryos injected with npc2 mRNA appeared identical to the Mnpc2+/m embryo injected with either egfp or npc2 mRNA. MZnpc2m/m embryos injected with egfp RNA still displayed the defects found in uninjected MZnpc2m/m embryos. EGFP signal is shown in the insets. Scale bars: 500 μm. (B) Magnified images of otic vesicles. The otic vesicle and otoliths were normal in the MZnpc2m/m embryo injected with npc2 mRNA (arrowheads). Scale bar: 250 μm. PHENOTYPE:
|
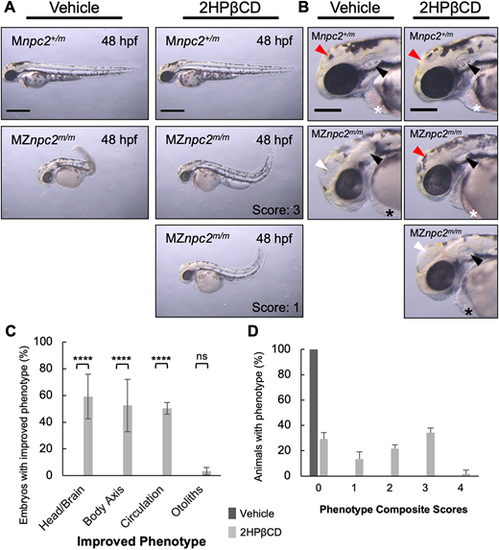
(A) Live imaging of 48 hpf Mnpc2+/m and MZnpc2m/m embryos injected with either vehicle (Mnpc2+/m n=53, MZnpc2m/m n=76) or 100 pmol of 2HPβCD (Mnpc2+/m n=81, MZnpc2m/m n=80) at 2.5 hpf (n=3 experiments). Many 2HPβCD-injected MZnpc2m/m embryos showed milder defects, including more normal head/brain appearance, restored red blood cell circulation, and less-curved body axis than observed in vehicle-injected MZnpc2m/m embryos. Two representative images of 2HPβCD-injected MZnpc2m/m embryos are shown with their corresponding corrected phenotype. Phenotype composite scores of vehicle and 2HPβCD-treated MZnpc2m/m embryos are shown (Score 3: improved head/brain appearance, restored red blood cell circulation, and less-curved body axis; Score 1: less-curved body axis). Individuals exhibiting all four defects (the lack of otoliths, abnormal head/brain development, absent circulating red blood cells and a curved/twisted body axis) received a score of 0, and individuals with none of the four defects received a score 4. Experiments were repeated three times. All Mnpc2+/m embryos injected with either vehicle or 2HPβCD displayed normal phenotype, and all MZnpc2m/m injected with vehicle displayed abnormal phenotypes including all defects described above. Scale bars: 500 μm. (B) Magnifications of the images in A showed that although 2HPβCD was able to partially rescue some defects in MZnpc2m/m embryos, otoliths were still not seen in 2HPβCD-treated MZnpc2m/m embryos despite some of embryos displaying more organized otic vesicles (black arrowheads). Some 2HPβCD-treated MZnpc2m/m embryos displayed improved head/brain appearance (red arrowheads) as they did not exhibit the enlarged hollow compartment (white arrowheads) found in vehicle-treated MZnpc2m/m embryos. Red blood cells were found in the pericardial region of some 2HPβCD-injected MZnpc2m/m embryos (white asterisks) but not in vehicle-injected MZnpc2m/m embryos and some more severe 2HPβCD-injected MZnpc2m/m embryos (black asterisks), consistent with restored circulation. Scale bars: 200 μm. (C) 2HPβCD-injected 48 hpf MZnpc2m/m embryos displayed improved phenotype in head/brain structure, body axis and circulation but the absent otolith phenotype was still largely unchanged. n=76 (vehicle-injected MZnpc2m/m embryos) and n=80 (2HPβCD-injected MZnpc2m/m embryos) (n=3 experiments. ****P<0.0001 (χ2, Fisher's exact test). ns, not significant. (D) Distribution of phenotype composite scores of vehicle and 2HPβCD-treated MZnpc2m/m embryos. Most 2HPβCD-treated MZnpc2m/m embryos showed improvement in one to three individual findings. |
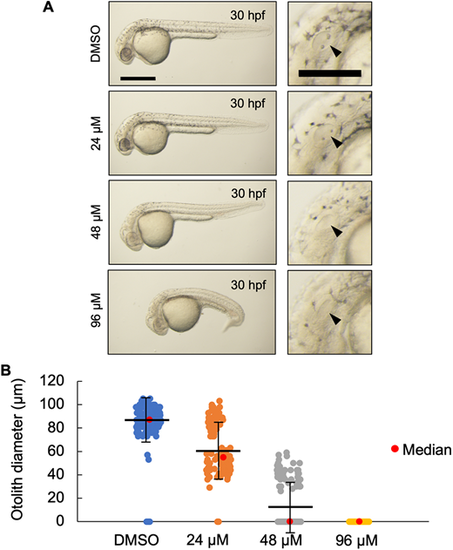
(A) Live imaging of 30 hpf wild-type embryos treated with the indicated dose of U18666A starting at 4 hpf. U18666A-treated embryos exhibited a dose-dependent phenotype ranging from smaller otoliths at 24 μM to no otoliths, abnormal head, no circulating blood cells, and curved/twisted body axis at 96 μM. Arrowheads indicate the otic vesicle. Scale bars: 500 μm (whole embryo); 200 μm (otic vesicle). (B) Measurement of otolith diameters from DMSO- and U18666A-treated wild-type embryos at 30 hpf. n=118 (DMSO), 118 (24 μM), 114 (48 μM) and 94 (96 μM) (n=2 experiments). Two otoliths per embryo were measured. 0 indicates that otolith was not detectable. P<0.0001 for each treatment group compared with DMSO (Kruskal–Wallis test). PHENOTYPE:
|
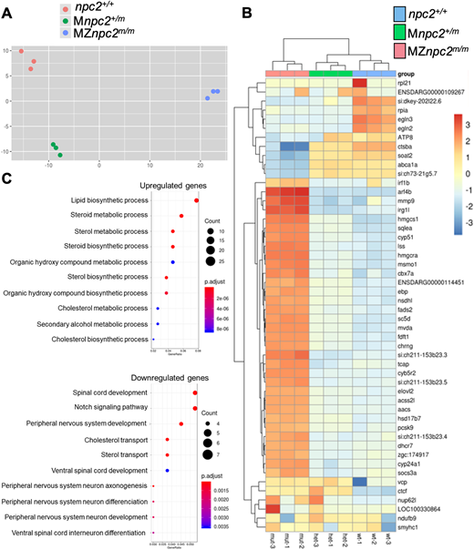
m/m (A) Principal component analysis (PCA) of each pool of mRNA from all three genotypes: npc2+/+, Mnpc2+/m and MZnpc2m/m. These data suggested that MZnpc2m/m transcriptomes differed more compared with npc2+/+ and Mnpc2+/m transcriptomes than npc2+/+ differed from Mnpc2+/m (x-axis: 67% of variance; y-axis: 14% of variance). (B) Heatmap of the top 50 genes with the most expression variation. The heatmap plots the deviation from the row mean. (C) Dotplot of GO biological process enrichment in genes differentially expressed between mutant and heterozygote. This represents highly enriched GO biological process terms from the analysis with the color corresponding to level of enrichment (adjusted P-value) and the size of the dots representing the number of genes associated with the GO term. |
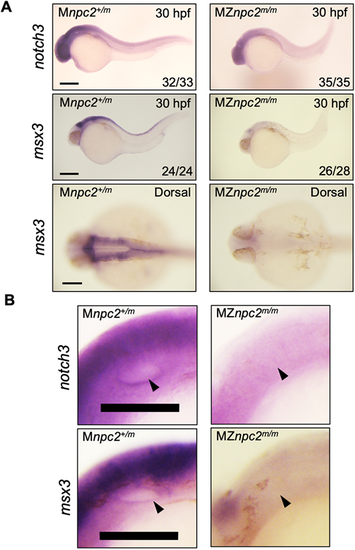
(A) Whole-mount RNA in situ hybridization for notch3 and msx3 in 30 hpf Mnpc2+/m and MZnpc2m/m embryos. Expression of both notch3 and msx3 was observed mainly in the head area and was reduced in MZnpc2m/m embryos compared with Mnpc2+/m embryos. The numbers of embryos examined showing the represented staining over the total numbers of embryos examined are indicated in each image (n=3 experiments). Scale bars: 200 μm (30 hpf); 100 μm (dorsal). (B) Magnifications of the otic vesicles shown in A. Both notch3 and msx3 were expressed along the lining of the otic vesicle in Mnpc2+/m embryos. However, their expression was diminished around the otic vesicle in MZnpc2m/m embryos (arrowheads). Scale bars: 100 μm. |
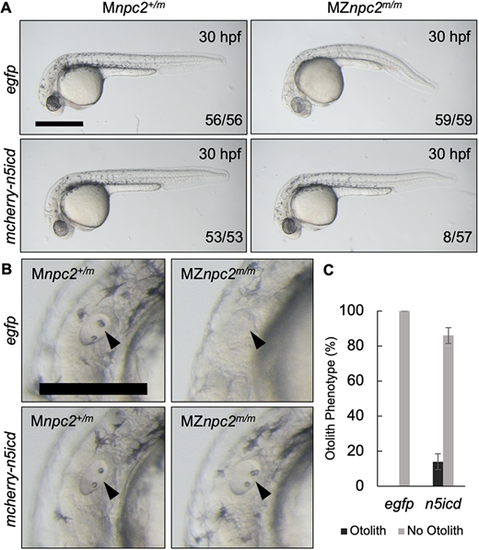
(A) Live imaging of 30 hpf Mnpc2+/m and MZnpc2m/m embryos injected with either egfp or mcherry-n5icd (notch3 intracellular domain) plasmid DNA at the 1-cell stage. Some of the mcherry-n5icd-injected MZnpc2m/m embryos (13.92±4.43%) displayed a relatively normal phenotype in comparison with egfp-injected MZnpc2m/m embryos. Numbers of embryos examined showing representing staining over total numbers of embryos examined are indicated in each image (n=4 experiments). Scale bar: 500 μm. (B) Magnifications of the images shown in A in the area of the otic vesicle. Both otoliths and otic vesicle were restored in this mcherry-n5icd-injected MZnpc2m/m embryo (arrowheads). Scale bar: 250 μm. (C) Quantification of otolith phenotype recovery in egfp- (n=59) and mecherry-n5icd-injected MZnpc2m/m embryos (n=58). P=0.0028 for ‘no otolith' in n5icd-treated group versus ‘no otolith' in egfp-treated group (χ2, Fisher's exact text). |

ZFIN is incorporating published figure images and captions as part of an ongoing project. Figures from some publications have not yet been curated, or are not available for display because of copyright restrictions. PHENOTYPE:
|
|
ZFIN is incorporating published figure images and captions as part of an ongoing project. Figures from some publications have not yet been curated, or are not available for display because of copyright restrictions. PHENOTYPE:
|
|
ZFIN is incorporating published figure images and captions as part of an ongoing project. Figures from some publications have not yet been curated, or are not available for display because of copyright restrictions. |
|
ZFIN is incorporating published figure images and captions as part of an ongoing project. Figures from some publications have not yet been curated, or are not available for display because of copyright restrictions. |