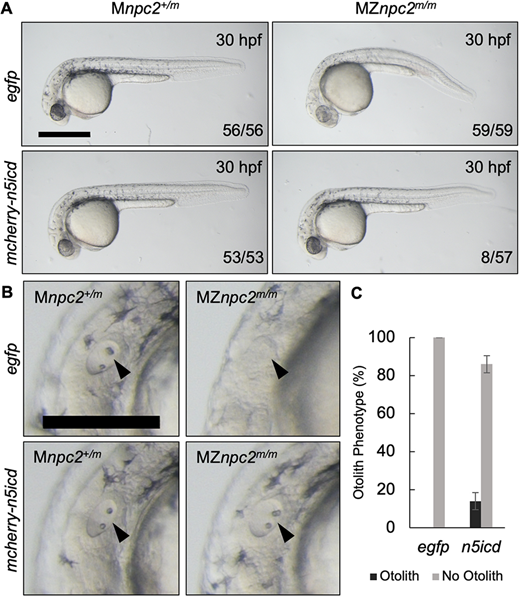
Fig. 11 (A) Live imaging of 30 hpf Mnpc2+/m and MZnpc2m/m embryos injected with either egfp or mcherry-n5icd (notch3 intracellular domain) plasmid DNA at the 1-cell stage. Some of the mcherry-n5icd-injected MZnpc2m/m embryos (13.92±4.43%) displayed a relatively normal phenotype in comparison with egfp-injected MZnpc2m/m embryos. Numbers of embryos examined showing representing staining over total numbers of embryos examined are indicated in each image (n=4 experiments). Scale bar: 500 μm. (B) Magnifications of the images shown in A in the area of the otic vesicle. Both otoliths and otic vesicle were restored in this mcherry-n5icd-injected MZnpc2m/m embryo (arrowheads). Scale bar: 250 μm. (C) Quantification of otolith phenotype recovery in egfp- (n=59) and mecherry-n5icd-injected MZnpc2m/m embryos (n=58). P=0.0028 for ‘no otolith' in n5icd-treated group versus ‘no otolith' in egfp-treated group (χ2, Fisher's exact text).
Image
Figure Caption
Acknowledgments
This image is the copyrighted work of the attributed author or publisher, and
ZFIN has permission only to display this image to its users.
Additional permissions should be obtained from the applicable author or publisher of the image.
Full text @ Development

