
- Title
-
Altered non-coding RNA expression profile in F1 progeny 1 year after parental irradiation is linked to adverse effects in zebrafish
- Authors
- Martín, L., Kamstra, J.H., Hurem, S., Lindeman, L.C., Brede, D.A., Aanes, H., Babiak, I., Arenal, A., Oughton, D., Salbu, B., Lyche, J.L., Aleström, P.
- Source
- Full text @ Sci. Rep.
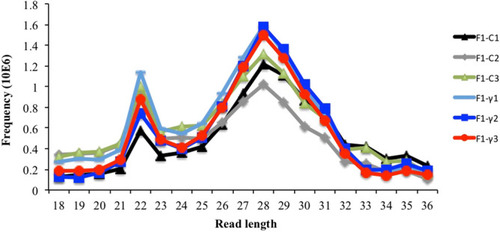
Reads length distribution of raw sequence reads after filtering by read length. Three biological replicate libraries per group of F1 generation (5.5 hpf embryos) from parents exposed to 8.7 mGy/h of γ-radiation (F1-γ) and control parents (F1-C). |
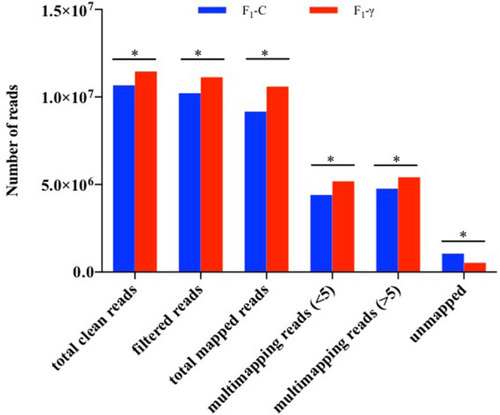
General statistics of reads mapping to zebrafish genome (GRCz10). Three biological replicate libraries per group of F1 generation (5.5 hpf embryos) from parents exposed to 8.7 mGy/h of γ-radiation (F1-γ) and control parents (F1-C). Total clean reads represent the number of reads after QC analysis and filtering. Filtered reads indicate the number of reads after size filtering. Total mapped reads indicate the number of reads mapped to zebrafish reference genome after size filtering. Multimapping reads < 5 include reads aligning to < 5 genomic locations. Multimapping reads > 5, indicate reads mapped to > 5 genomic locations. Unmapped reads show the amount of reads which could not be aligned to the genome. Asterisks represent significant differences p < 0.0001, Chi-square with Yates correction of continuity. |
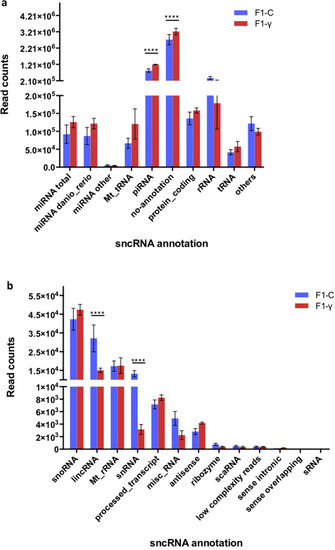
Distribution of mapped reads (zebrafish genome reference GRCz10) onto genomic features. F1 generation of embryos (5.5 hpf) from parents 1 year after exposure to 8.7 mGy/h γ-radiation (F1-γ) and control parents (F1-C). Values derived from three replicates in each group (n = 3). Asterisks denote statistical differences with p < 0.001, multiple t tests (FDR 99%). ( |
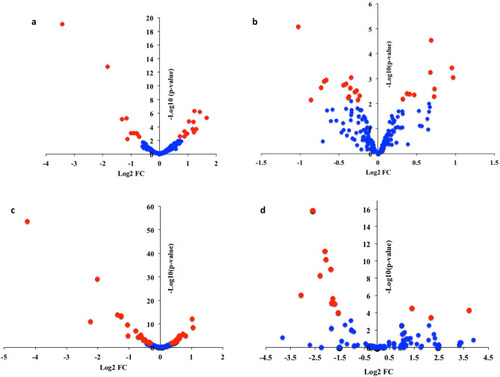
Differential expression analysis of miRNAs ( |
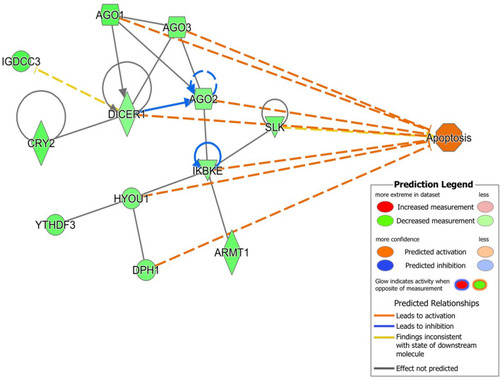
mRNA targets of let-7g involved in apoptosis network and showing the involvement of members of the miRNA biosynthesis pathway as well as other genes. This network predicts activation of apoptosis as shown by the orange edges between nodes. Arrowed blue lines predict inhibition. Green nodes indicate down-regulated genes. |
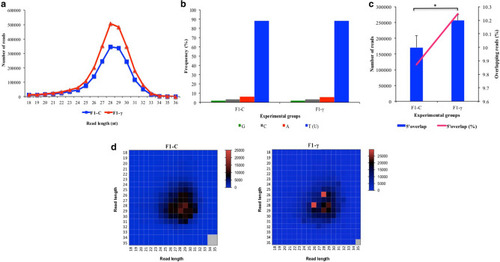
Analysis of piRNA signatures in clusters predicted in F1 generation of embryos (5.5 hpf) from parents exposed to 8.7 mGy/h γ-radiation (F1-γ) and non-exposed control parents (F1-C) (n = 3). A) Read length distribution. B) Per base distribution analysis. C) 5′10nt overlap distribution. Asterisk indicates significant differences (p < 0.05; paired t test). D) Read length analysis of reads with 5′ 10nt overlapping (ping-pong signatures; average Z score F1-C = 44.2, and F1-γ = 42.9; p < 0.01). |
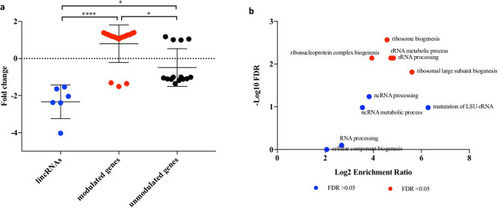
Expression and biological processes of genes within the co-expression network of DElincRNAs in the generation F1 of embryos (5.5 hpf) from parents exposed to 8.7 mGy/h γ-radiation (F1-γ). Gene expression values from our parallel differential expression data (GSE98539) |