IMAGE

Figure 7

ID
ZDB-IMAGE-210225-7
Source
Figures for Martín et al., 2021
Image
Figure Caption

Figure 7

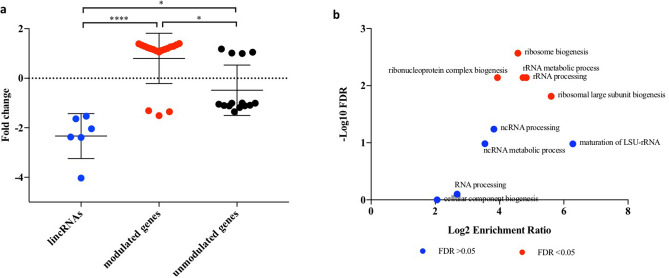
Expression and biological processes of genes within the co-expression network of DElincRNAs in the generation F1 of embryos (5.5 hpf) from parents exposed to 8.7 mGy/h γ-radiation (F1-γ). Gene expression values from our parallel differential expression data (GSE98539)9. (A) DElincRNAs expression level compared to modulated and unmodulated genes within the co-expression network. Modulated genes represent differentially expressed (FDR < 0.05), unmodulated genes represent not differentially expressed (FDR > 0.05). Asterisks indicate significant differences (**** p < 0.0001, * p < 0.05, Kruskal–Wallis and Dunn’s multiple comparison test, n = 3). (B) Overrepresented GO terms under the category biological processes from modulated genes in A (FDR < 0.05 Benjamini–Hochberg).

Acknowledgments
This image is the copyrighted work of the attributed author or publisher, and ZFIN has permission only to display this image to its users. Additional permissions should be obtained from the applicable author or publisher of the image. Full text @ Sci. Rep.