FIGURE

Figure 3

ID
ZDB-FIG-210225-3
Publication
Martín et al., 2021 - Altered non-coding RNA expression profile in F1 progeny 1 year after parental irradiation is linked to adverse effects in zebrafish
Other Figures
All Figure Page
Back to All Figure Page
Figure 3

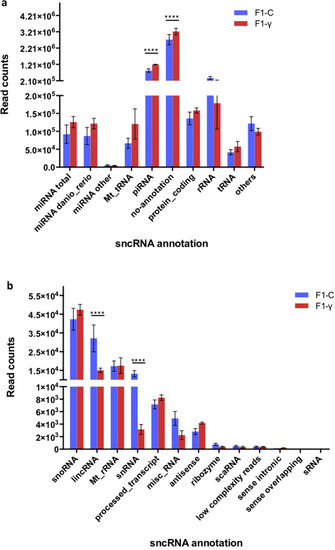
Distribution of mapped reads (zebrafish genome reference GRCz10) onto genomic features. F1 generation of embryos (5.5 hpf) from parents 1 year after exposure to 8.7 mGy/h γ-radiation (F1-γ) and control parents (F1-C). Values derived from three replicates in each group (n = 3). Asterisks denote statistical differences with p < 0.001, multiple t tests (FDR 99%). (A) miRNA total (total of reads mapping to microRNAs (miRNA)), miRNA danio_rerio (zebrafish miRNAs), miRNA other (miRNAs from other species), Mt_tRNA (mitochondrial transference RNA), piRNA (piwi-interacting RNA), no-annotation (mapped reads, which could not be assigned to any genomic feature), protein_coding (protein coding transcripts), rRNA (ribosomal RNA), tRNA (genomic transference RNA), others (sum of all reads mapping to genomic features presented in (B). (B) snoRNA (small nucleolar RNA), lincRNA (long intergenic non-coding RNA), Mt_rRNA (mitochondrial ribosomal RNA), snRNA (small nuclear RNA), misc_RNA (miscellaneous RNA), scaRNA (small cajal-body-spacific RNA), sRNA (bacterial small RNA).

Expression Data

Expression Detail
Antibody Labeling
Phenotype Data

Phenotype Detail
Acknowledgments
This image is the copyrighted work of the attributed author or publisher, and ZFIN has permission only to display this image to its users. Additional permissions should be obtained from the applicable author or publisher of the image. Full text @ Sci. Rep.