
|
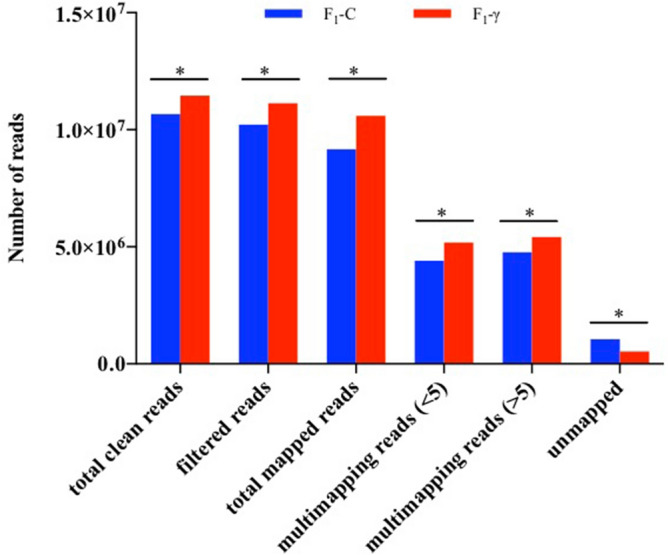
Figure 2
General statistics of reads mapping to zebrafish genome (GRCz10). Three biological replicate libraries per group of F1 generation (5.5 hpf embryos) from parents exposed to 8.7 mGy/h of γ-radiation (F1-γ) and control parents (F1-C). Total clean reads represent the number of reads after QC analysis and filtering. Filtered reads indicate the number of reads after size filtering. Total mapped reads indicate the number of reads mapped to zebrafish reference genome after size filtering. Multimapping reads < 5 include reads aligning to < 5 genomic locations. Multimapping reads > 5, indicate reads mapped to > 5 genomic locations. Unmapped reads show the amount of reads which could not be aligned to the genome. Asterisks represent significant differences p < 0.0001, Chi-square with Yates correction of continuity.