
Image
|
Figure Caption
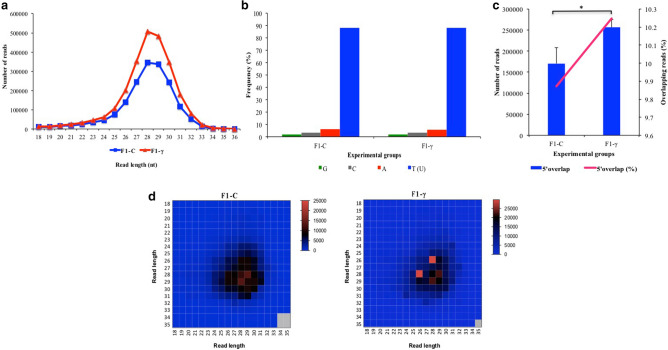
Figure 6
Analysis of piRNA signatures in clusters predicted in F1 generation of embryos (5.5 hpf) from parents exposed to 8.7 mGy/h γ-radiation (F1-γ) and non-exposed control parents (F1-C) (n = 3). A) Read length distribution. B) Per base distribution analysis. C) 5′10nt overlap distribution. Asterisk indicates significant differences (p < 0.05; paired t test). D) Read length analysis of reads with 5′ 10nt overlapping (ping-pong signatures; average Z score F1-C = 44.2, and F1-γ = 42.9; p < 0.01).
Acknowledgments
This image is the copyrighted work of the attributed author or publisher, and
ZFIN has permission only to display this image to its users.
Additional permissions should be obtained from the applicable author or publisher of the image.
Full text @ Sci. Rep.